A social media analytics template is useful only when it turns scattered platform numbers into a repeatable decision process. The best choice isn't the template with the most colorful charts. It's the one that helps you decide what to publish, what to repeat, and what to stop doing.
This list compares spreadsheet, presentation, database, and dashboard formats by setup effort, reporting audience, automation, customization, and KPI usefulness. It also shows how to adapt each one for Instagram Reels, TikTok, Stories, static posts, and cross-platform content.
The practical benchmark is simple: can the system move you from Profile Audit to Trends & Ideas, Content Creation, and Performance Analysis? That means tracking more than likes. You need a place for ready-to-shoot video scripts, hooks, scene structures, carousels, visual post concepts, Instagram and TikTok content, LinkedIn posts, and Threads/X posts. For a broader guide to analyze content performance, the same principle applies: measurement should lead to a next action.
You can use Trendy through heytrendy.app, the Trendy iOS app, or the Trendy Android app.
1. Trendy
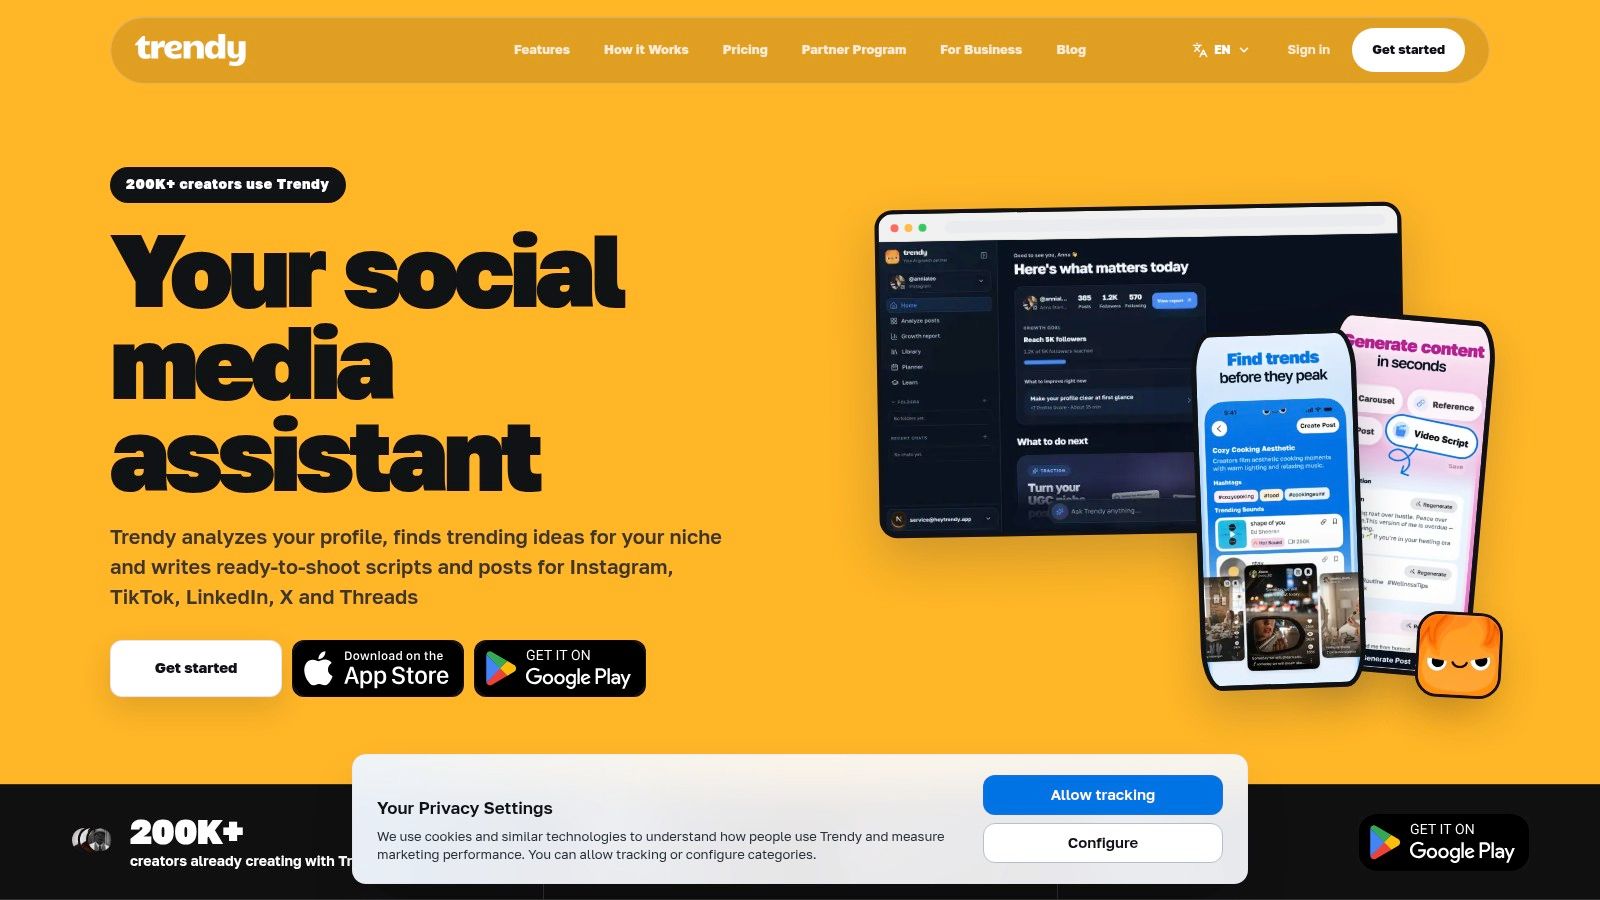
Trendy is the strongest fit when you don't want a social media analytics template to remain a passive spreadsheet. It connects profile insight, content ideation, creation support, and performance coaching in one creator workflow.
Start with a Profile Audit to identify weaknesses in your account and content mix. Move into Trends & Ideas for category-relevant concepts, hooks, ready-to-shoot scripts, and emerging sounds or hashtags. Then use the creation workflow for scene structures, carousels, visual post concepts, Reels, TikToks, LinkedIn posts, and Threads/X posts. Performance Analysis closes the loop by explaining what worked and what to improve next.
Where Trendy earns its place
A conventional report tells you that reach or engagement changed. Trendy is designed to help translate that change into a content decision, such as repeating a format, testing a different hook, or adjusting the posting plan. That makes it useful for creators who need a social media co-pilot, not another dashboard to interpret alone.
The system supports multiple platforms, including Instagram, TikTok, Threads, X, LinkedIn, and YouTube. It also aims to preserve a creator's brand aesthetic while keeping recommendations practical rather than handing over generic AI copy.
Practical rule: Use analytics to choose the next experiment, not to decorate a retrospective report.
Trendy still needs human judgment. AI suggestions may need edits for voice, product accuracy, audience nuance, and visual style. It also isn't a completely hands-off publisher, so creators who want a fully automated scheduling and publishing suite may need another tool alongside it.
For the reporting side, see Trendy's social media analytics and reporting workflow. The Trendy website has the latest information about available plans and trial options, which may change.
2. Hootsuite
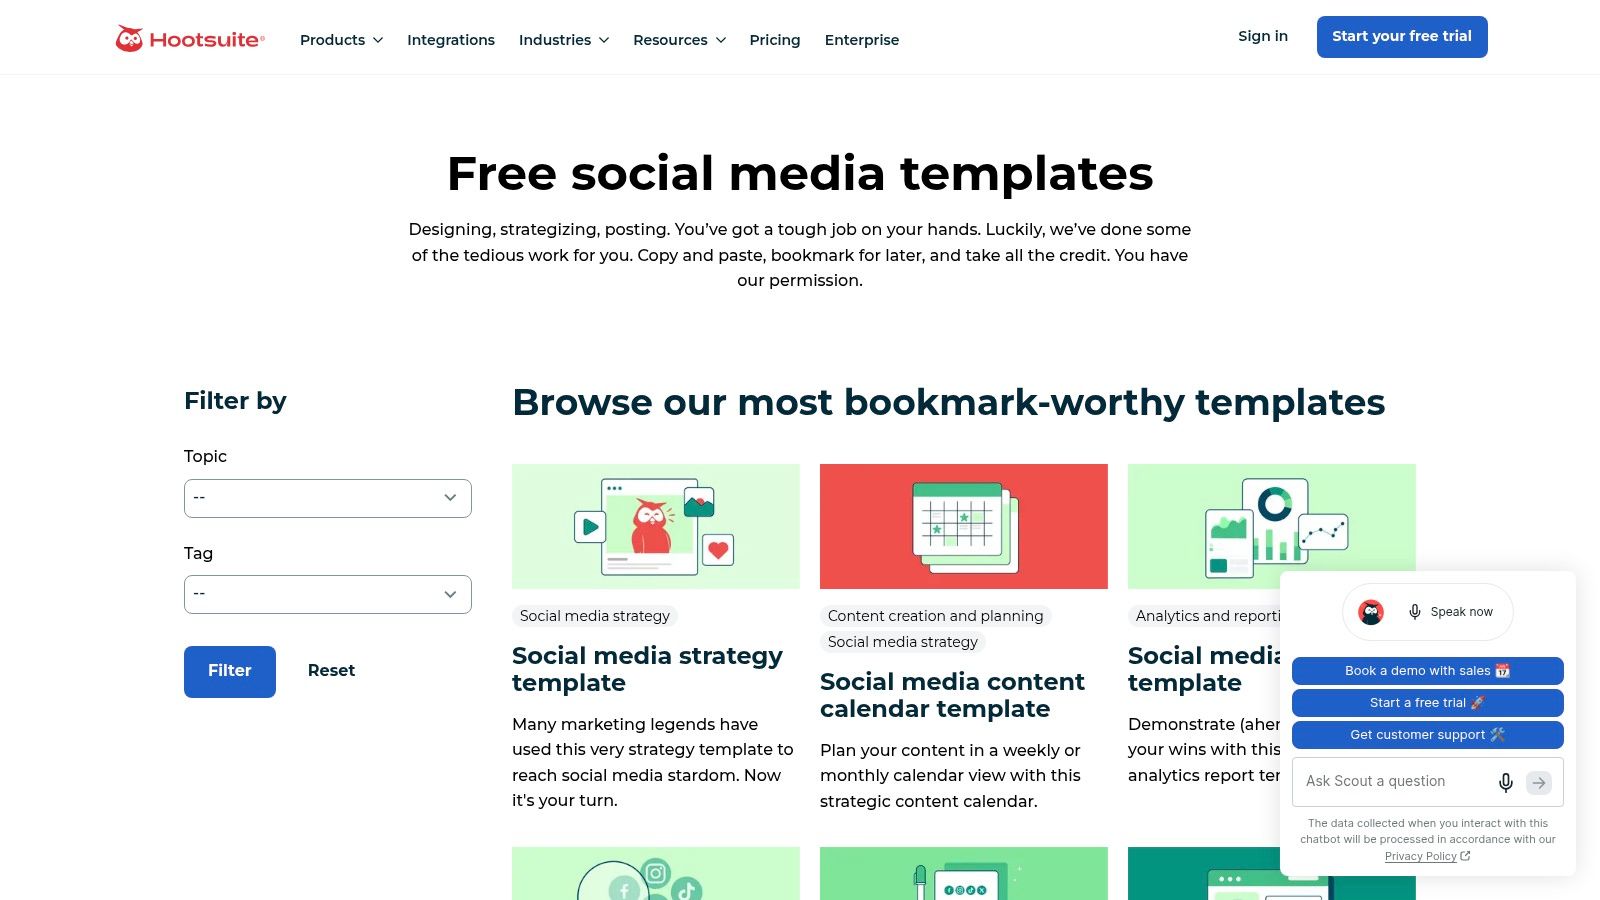
Hootsuite's social media report templates are built for the person who has the numbers but needs to turn them into a presentation. The format suits monthly or quarterly reporting, especially when a client, manager, or leadership team wants a clear summary rather than a live analytics workspace.
The useful structure puts goals, KPIs, channel performance, top posts, audience trends, and takeaways into a stakeholder-friendly sequence. You can bring data from different sources, which means you don't have to migrate your entire workflow just to produce a credible report.
Best use and real limitation
Hootsuite works well when the report has a narrative. A strong version might explain that Reels earned broader discovery, Stories generated profile actions, and a carousel produced more saves. The template gives you somewhere to make that argument instead of dropping isolated figures onto a page.
The trade-off is manual upkeep unless you pair the template with Hootsuite reporting. That matters for small teams because copying data from Instagram, TikTok, and other platforms can become the least valuable task in the workflow. The download also requires an email, so it isn't as frictionless as an open spreadsheet.
Use this pick for client decks and executive summaries, not as your only source of truth. Keep a working sheet with post-level data, then use the Hootsuite format to explain the decisions that follow.
3. HubSpot
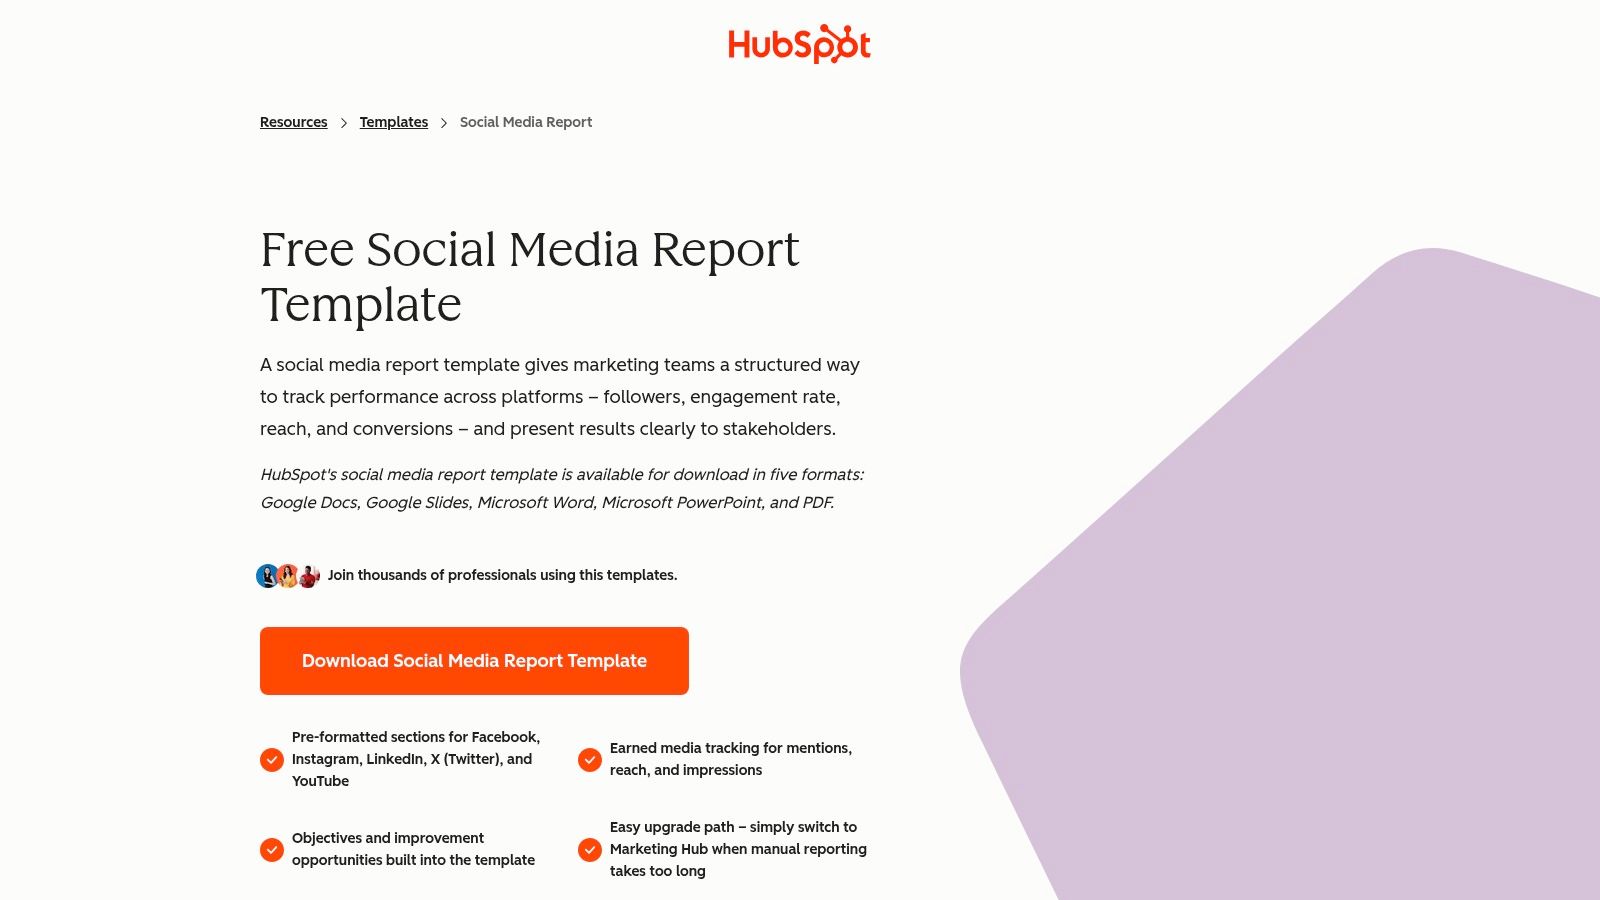
HubSpot's social media report template is a practical choice for agencies and teams that need a repeatable presentation format across accounts. It comes in Google Slides, Google Docs, PowerPoint, Word, and PDF formats, so the template can fit an existing approval process instead of forcing everyone into one application.
The layout supports channel highlights, KPI trends, top content, reporting cadence, and stakeholder alignment. That educational layer is valuable for less experienced clients because it helps explain not only what to include, but why a metric belongs in the report.
The reporting decision it supports
HubSpot is strongest when social reporting sits close to broader marketing reporting. Teams already using HubSpot data can connect social activity to a wider customer journey, while agencies can standardize the visual structure before customizing the content for each client.
That doesn't make the template automatically analytical. Without connected reporting tools, someone still has to update the figures, check platform definitions, and write the interpretation. A slide that says engagement increased isn't useful unless it also identifies the content format, denominator, and business implication.
For a creator-focused alternative to a formal deck, Trendy's guide to a social media reporting template is more directly suited to turning post results into content decisions. HubSpot remains the better fit when several stakeholders need a polished, standardized document.
4. Later
Later's social media reporting templates are a good match for Instagram- and TikTok-heavy teams that care about visual presentation. The pack includes Google Slides and PDF formats, with sections for platform KPIs, post performance, and next-month actions.
The visual structure makes it easier to show a client which creative performed best, rather than forcing them to read a dense export. The accompanying tutorial and examples also help newer social managers understand how to keep a report concise.
Reels and TikTok need more than a total
A Later report becomes more useful when you separate content formats. For Instagram, track Reels, Stories, carousels, and single-image posts independently. For TikTok, distinguish short tutorials, trend-led clips, product demonstrations, and Live promotion. Combining everything into one average hides the creative choices that caused the result.
Instagram's official Reels guidance says creators can record and edit multi-clip videos totaling up to 3 minutes. Reels can combine clips, music or original audio, text, and augmented-reality effects. Templates require music and at least 3 clips, so a planning sheet should record the format and structure, not just the final views.
Later's weakness is the same as most slide templates: manual entry unless data comes from Later analytics. Some reporting features also depend on the plan. Choose it when polished visual communication matters more than a fully automated reporting pipeline.
5. Sprout Social
Sprout Social's social media reporting toolkit covers more reporting situations than a simple monthly scorecard. It includes formats for executive summaries, internal dashboards, scorecards, profile audits, benchmarking, and social listening reports.
That breadth matters when different audiences ask different questions. Leadership may want a short summary, a social manager may need a profile audit, and a communications team may care about brand or industry conversation. One template rarely serves all three without becoming bloated.
A useful fit for mature reporting teams
Sprout Social works best when reporting has several layers. Start with a profile health review, add channel performance, highlight content patterns, then create a recommendation section for the next period. A listening report can sit beside those documents when audience conversation matters as much as published content.
The trade-off is commitment. The toolkit is most useful alongside Sprout Social's analytics suite, and many downloads are gated behind forms. Solo creators may find the system heavier than necessary, particularly if they only need to compare a few Reels, TikToks, and Stories.
Use a metric hierarchy rather than filling every field. Presence can include posting frequency. Exposure can include reach, impressions, views, or video plays. Interaction can include likes, comments, shares, reposts, saves, mentions, and tags. The distinction follows established measurement frameworks described by social media measurement history, which emphasize connecting outputs to outcomes rather than stopping at activity.
For a focused KPI framework, see Trendy's guide to KPIs for social media.
6. Supermetrics
Supermetrics' Looker Studio organic social dashboard template is for teams that have outgrown manual slide updates. It provides a dashboard structure for engagement, growth, and content performance, then refreshes data after the required Supermetrics connectors are configured.
The main advantage is obvious: you can share a live dashboard rather than rebuild the same report every month. Agencies can also create a repeatable view for recurring client work, with filters that separate accounts, channels, periods, and content types.
Automation has a setup cost
Supermetrics doesn't remove complexity. You need the connectors, access permissions, data mapping, and Looker Studio knowledge to make the dashboard trustworthy. A live chart with inconsistent definitions is worse than a manual report because it gives false confidence at speed.
Store the denominator beside each rate. Engagement rate by reach, share rate by reach, follower conversion rate, and median views per post answer different questions. Rival IQ's benchmark methodology separates descriptive metrics such as reach, impressions, views, likes, comments, shares, saves, and follower growth from diagnostic metrics such as engagement rate, posting frequency, content format, hashtag use, and percentile position.
For a practical setup guide, use Trendy's article on how to track social media analytics. For teams building an API-driven social media dashboard, Supermetrics is closer to the automated end of the spectrum than a slide deck.
7. Databox
Databox's social media dashboard templates fit agencies that need client-ready views across Instagram, Facebook, LinkedIn, YouTube, and TikTok. Prebuilt metrics and integrations reduce the work of creating a dashboard from an empty canvas, though each account still needs consistent connections and metric definitions.
Choose a starting layout, connect the relevant sources, then separate organic and paid performance. Scheduled snapshots work well for clients who want a recurring narrative summary rather than another platform login. They are less useful for creators who need to inspect individual posts and adjust content during the week.
Where Databox falls short
Databox handles visual monitoring better than creative diagnosis. It can show that a TikTok outperformed the account average, but it will not identify whether the hook, sound, topic, editing pace, or audience segment caused the result.
Customize the dashboard around the content decisions you make. Add views for Instagram Reels, Stories, feed posts, and TikToks, then include fields for format, opening hook, call to action, and discovery source. A short insight field beside each chart can capture why a post worked and what to test next. Cross-platform comparisons then reveal whether a concept travels well or depends on one platform's distribution.
Agency costs and connection limits also deserve attention. More users or data sources may require paid plans, so calculate the reporting time saved before standardizing Databox for every client. For a deeper guide to a social media dashboard, begin with the reporting question and choose visualizations that support that decision.
8. Airtable
Airtable's social media report template sits between a spreadsheet, a database, and a workflow tool. Its base structure can hold channel KPIs, post performance, and campaign tracking, while interfaces provide quick dashboards for people who don't want to work inside raw records.
This is the most flexible choice for a small team that wants planning and reporting in one place. A content record can include the brief, owner, status, platform, format, publication date, creative link, results, and postmortem. That connection helps teams compare what they planned with what occurred.
Build the record around decisions
Create separate fields for Instagram Reels, Stories, carousels, static posts, TikToks, LinkedIn posts, and Threads/X posts. Add a controlled field for the objective, such as awareness, engagement, profile action, lead generation, or sale. Then connect the result to the next action, rather than leaving the insight in a meeting note.
Airtable's weakness is data ingestion. Automated sync may require connectors or automations, and the default visualizations aren't as polished as dedicated business-intelligence tools. Still, the ability to combine a content calendar, approvals, creative assets, and analytics often outweighs that limitation for small teams.
Use Airtable when the question is, “How do we run the work and remember what happened?” Choose Supermetrics or Databox when the question is, “How do we refresh a reporting dashboard with less manual effort?”
9. Smartsheet
Smartsheet's social media report templates are a dependable choice for teams that want familiar spreadsheet tools without vendor lock-in. The collection includes Excel, Google Sheets, and Smartsheet formats, with dashboard-style views, monthly summaries, and top-content sections.
The appeal is practical. A freelancer can copy the file, add a row for each channel, and start recording results without learning a new database or dashboard language. Teams can share, archive, and revise the document as their reporting needs change.
Make the spreadsheet earn its keep
A blank row for “engagement” isn't enough. Add separate fields for reach, impressions, views, watch time, saves, shares, comments, profile actions, and follower change when the platform provides them. Keep the original platform definition beside the field, because likes, views, impressions, and reach don't mean the same thing across Instagram, TikTok, LinkedIn, and other networks.
For Instagram Reels, record the creative format and the opening hook. For TikTok, add trend source, hashtag cluster, sound, and whether the video was part of a recurring series. For Stories, record taps, replies, exits, and profile actions where available. The goal isn't to collect every number. It's to identify repeatable creative patterns.
Smartsheet's limitation is manual upkeep unless you add connectors. Its dashboards are also less interactive than dedicated BI tools. Pick it when speed, familiarity, and portability matter more than automation. It's especially suitable for a solo creator or small business that wants a durable reporting habit before paying for a complex stack.
10. Lemonpost
Lemonpost's monthly social media report template is the leanest option in this list. It focuses on a concise executive summary, targets versus results, top posts, short explanations of why they worked, and recommendations for the next month.
That structure is valuable because many small teams don't have a data problem. They have a follow-through problem. A short report that gets completed is more useful than an ambitious dashboard abandoned after the first reporting cycle.
A good starter system for freelancers
The one-row-per-channel layout makes it easy to compare targets and results, while the top-post section forces a useful question: why did this content work? Write the answer in concrete terms, such as a clearer hook, a stronger product demonstration, a timely topic, or a more useful carousel structure.
Lemonpost is available in Excel, Google Sheets, and Apple Numbers. Its design is intentionally minimal, so don't expect a deep chart library or built-in automation. You'll need separate data pulls if you want the report to update itself.
Use it for a monthly review, then turn the recommendations into next month's content calendar. A creator might select one Reels format to repeat, one TikTok idea to adapt, and one Story sequence to test. That is enough structure to build momentum without pretending that every metric deserves equal attention.
Top 10 Social Media Analytics Template Comparison
| Product | Core features | UX / Quality (★) | Value & Pricing (💰) | Target audience (👥) | Unique selling point (✨) |
| 🏆 Trendy | Personalized post ideas, hooks, ready-to-shoot scripts; multi-platform posting plan & engagement predictions | ★4.8, 200K+ creators | 💰 Check site, free start/trial possible | 👥 Creators, brands, SMBs | ✨ Agentic interface + trend detection; actionable coaching, 🏆 Recommended |
| Hootsuite, Social Media Report Template | Presentation-ready slides: executive summary, channel performance, top posts | ★★★, stakeholder-friendly | 💰 Free template (email gated) | 👥 Teams wanting plug-and-play reports | ✨ Slide scaffolding + reporting guidance |
| HubSpot, Free Social Media Report Template | Multi-format (Slides/Docs/PPT/Word/PDF) + step-by-step reporting guide | ★★★★, educational & standardized | 💰 Free (email gated); integrates with HubSpot | 👥 Agencies & teams standardizing reports | ✨ Multi-format export + HubSpot compatibility |
| Later, Reporting Templates | Google Slides/PDF templates, KPI sections, how‑to examples | ★★★★, polished, client-ready | 💰 Free templates; some features plan-dependent | 👥 Instagram & TikTok focused teams | ✨ Polished slides + tutorial/examples |
| Sprout Social, Reporting Toolkit | Executive summaries, scorecards, audits, social listening templates | ★★★★, comprehensive & example-rich | 💰 Mostly gated; best with Sprout analytics (paid) | 👥 Mid/large teams & agencies | ✨ End-to-end reporting scenarios & audits |
| Supermetrics, Looker Studio Template | Looker Studio dashboard with cross-platform widgets & auto-refresh | ★★★★, live dashboards; setup required | 💰 Requires Supermetrics connectors (paid) | 👥 Data teams & agencies needing automation | ✨ Automated, live cross-platform dashboards |
| Databox, Dashboard Templates Library | 30+ prebuilt dashboards, one-click integrations, scheduled snapshots | ★★★★, fast visuals for clients | 💰 Free templates; paid for many connections/features | 👥 Agencies consolidating multiple clients | ✨ Client-ready dashboards + scheduled delivery |
| Airtable, Report Template (Base + Dashboards) | Prebuilt base: tables for KPIs, post performance, campaign tracking & dashboards | ★★★, flexible but less polished visuals | 💰 Free template; connectors/add-ons may cost | 👥 Teams combining planning & analytics | ✨ Combine analytics + workflow in one base |
| Smartsheet, Spreadsheet Templates | Excel/Sheets/Smartsheet dashboards, monthly summaries, top-content tabs | ★★★, familiar spreadsheet UX | 💰 Free downloads; manual updates unless connected | 👥 Teams preferring spreadsheet tools | ✨ No vendor lock-in; easy to share/archive |
| Lemonpost, Monthly Report Template | One-sheet monthly report: exec summary, targets vs results, top posts analysis | ★★★, lightweight & fast to fill | 💰 Free / lightweight template | 👥 Freelancers & SMBs | ✨ Extremely quick to fill; insight-focused |
Turn the Template Into a Weekly Growth Loop
The right social media analytics template depends on the job, not the brand name. Choose Lemonpost or Smartsheet when you need fast spreadsheet reporting with minimal setup. Pick Hootsuite, HubSpot, or Later when the main deliverable is a polished stakeholder or client deck. Use Airtable when planning, approvals, content records, and reporting need to live together.
Choose Supermetrics or Databox when recurring dashboards and connected data matter more than narrative slides. Select Sprout Social when your reporting covers several scenarios, such as executive summaries, audits, scorecards, benchmarking, and social listening. Trendy fits a different but complementary job. It connects measurement to ideation and creation for creators and small teams that need to know what to do next.
Before customizing any template, define the reporting period and the channel. Record the content format, whether it's an Instagram Reel, Story, carousel, static post, TikTok, TikTok Live promotion, LinkedIn post, or Threads/X post. Then add the metrics that match the format and objective:
- Distribution: Reach, impressions, and views.
- Video behavior: Watch time, retention or completion signals, and the creative structure.
- Interaction: Saves, shares, comments, likes, replies, reposts, and other platform-specific actions.
- Profile response: Profile visits, follows, link clicks, direct inquiries, and other profile actions.
- Audience movement: Follower change, follower versus non-follower reach, and audience segment where available.
- Business response: Landing-page sessions, UTM usage, coupon activity, lead quality, assisted conversions, and purchase or repeat-customer signals when relevant.
Don't mix incompatible definitions. A view on one platform may not represent the same behavior as a view on another. A cross-platform report should keep native metrics visible before creating an aggregate score. Dash Social's benchmark reporting illustrates why momentum and share behavior deserve their own fields, rather than being buried inside follower growth.
Small accounts also need protection from misleading averages. Favikon's 2025 benchmark report describes especially volatile TikTok engagement and differences between creator tiers. Store the median, percentile band, follower and non-follower reach, retention or completion rate, share rate, and a volatility indicator where the data supports it. That helps answer whether a post performed because the existing audience responded or because the platform temporarily recommended it to strangers.
Attribution needs the same discipline. A viral post can produce little commercial value, while a modestly engaged post can generate a qualified inquiry. Label outcomes as observed, assisted, or modeled, and combine platform data with first-party sales or CRM information instead of claiming deterministic causation. The measurement gap described in this discussion of creator and brand attribution is a reminder to treat social metrics as evidence, not magic proof.
The weekly loop should end with one clear action. Review the Profile Audit, identify an opportunity in Trends & Ideas, create the next asset with the right hook and scene structure, then use Performance Analysis to compare the result against your own baseline. Trendy is built around that sequence, with support for ready-to-shoot scripts, carousels, visual concepts, Instagram and TikTok content, LinkedIn posts, and Threads/X posts.
You can run that workflow on heytrendy.app, use the Trendy iOS app, or install the Trendy Android app. The template stores the evidence. The workflow turns it into a better next post.
Trendy combines profile audits, trend discovery, ready-to-shoot scripts, hooks, content planning, and performance guidance so your social media analytics template leads to action. Visit Trendy to connect your numbers with the next Instagram Reel, TikTok, Story, carousel, or cross-platform post worth making.