
A good social media reporting template isn't just a spreadsheet; it's your battle plan for growth. Think of it as the tool that turns a mountain of confusing data into a clear story about what’s actually working (and what’s a total flop). It organizes all those key performance indicators (KPIs) so you can see if you're hitting your goals or just shouting into the void. For content creators, this clarity is essential for turning content into a career, and tools like the Trendy iOS application are built to provide it instantly.
Let’s get real for a second. That feeling of your eyes glazing over as you stare at a monster spreadsheet, trying to decipher your social stats? We’ve all been there. It’s a digital nightmare. The endless loop of downloading CSVs, copy-pasting numbers, and wrestling with charts that look like they were made by a caffeinated squirrel is more than just a headache—it’s killing your momentum.

This manual grind is a certified time vampire. Every hour you spend on mind-numbing data entry is an hour you could have spent creating killer content or actually talking to your community. And the risk of human error? It's huge. One misplaced decimal or a busted formula can send your whole analysis off a cliff, leading you to make terrible decisions based on garbage data.
The problem runs much deeper than just lost time. When your data is a disorganized jumble, you lose the narrative. How are you supposed to explain that sudden follower spike to your boss? Or prove to a client that your new content strategy is actually paying off? Without a clean, consistent report, you're flying blind and hoping for the best.
Fixing this isn't just about social media; it’s a crucial part of streamlining business processes in general. You spot the bottlenecks and pave the way for real, scalable growth.
This is exactly why a smarter approach isn't a luxury—it's a necessity. Modern tools are built to slice right through this chaos. For creators, the Trendy iOS application is a game-changer. It flips the script, turning the reporting burden into a strategic advantage by delivering crisp, actionable insights right to your phone. With features like real-time analytics and content performance tracking, you stop hunting for data and get instant clarity on what's pushing you forward.
The hard truth is that old-school reporting methods don't just waste your time; they hide your opportunities. You can't jump on an emerging trend or pour gas on your best-performing content if you're still stuck wrestling with the basics.
It’s no wonder most marketing pros have already ditched this manual madness. A 2023 survey revealed that a whopping 78% of marketers rely on a standardized social media reporting template. A huge 65% of them save at least three hours per reporting cycle. Imagine what you could do with that time back! They’re laser-focused on the metrics that matter, like engagement (92%) and reach (87%).
When you finally kick that manual spreadsheet to the curb, you're not just clawing back a few hours. You're stepping into a system that gives you clarity, powers smarter decisions, and ultimately lets you grow your brand with confidence. The Trendy iOS application is designed to be that system for ambitious creators.
Alright, let's get real for a second. Before you even touch a spreadsheet or a template builder, you need to answer one killer question: What’s the point?
Seriously. Without a crystal-clear goal, you're just hoarding numbers that look pretty but mean absolutely nothing. Your report needs a purpose, a north star that guides every single metric you decide to track.
Are you trying to blast your brand name into the stratosphere and build massive awareness? Or are you laser-focused on getting people to click that "buy now" button on your latest merch drop? Each goal demands a completely different set of Key Performance Indicators (KPIs). Mixing them up is like trying to measure your car's speed with a thermometer—you'll get a number, but it won't tell you a damn thing.
It's time to ditch the vanity metrics. You know the ones—like that raw follower count—that puff up your ego but don't actually pay the bills. Let's get down to business and connect your social media grind to tangible, real-world outcomes. If you’re a content creator, this means getting brutally specific about what success actually looks like for you.
A great social media report doesn't just show data; it tells a story of progress towards a specific goal. Every KPI should serve as a chapter in that story, proving your efforts are making a real impact.
Once you've nailed down your primary objective, picking the right KPIs becomes way easier. Think of it as a matching game. To help you out, I've put together a quick cheat sheet.
A quick reference guide to help you select the most relevant Key Performance Indicators (KPIs) based on your primary social media objectives.
| Primary Goal | Key KPIs to Track | Why It Matters |
| Brand Awareness | Reach, Impressions, Mentions, Follower Growth | This is all about getting your name out there. These metrics show how many people are seeing and talking about your content. |
| Audience Engagement | Likes, Comments, Shares, Saves, Engagement Rate | This shows that your content is actually resonating with people, not just being scrolled past. An engaged audience is a loyal one. |
| Lead Generation | Website Clicks, Link Clicks, Form Fills, Email Sign-ups | You're turning followers into potential customers. These KPIs track how effectively you're moving people off-platform and into your funnel. |
| Sales & Conversions | Conversion Rate, Click-Through Rate (CTR), Revenue from Social | This is the bottom line. These metrics directly tie your social media activity to actual sales and prove your financial impact. |
Remember, the goal is to tell a compelling story, and these KPIs are your main characters.
And to truly understand the financial impact of all this work, you've got to master the art of measuring social media ROI. It’s what separates the pros from the amateurs.
For content creators, the Trendy iOS application is your secret weapon here. Instead of just guessing, you can use its powerful analytics to track these specific metrics in real-time. The app’s profile insight reports give you an undeniable view of which content is actually driving clicks, engagement, and audience growth. This helps you pick—and obsessively monitor—the KPIs that truly move the needle for your unique brand.
That way, you’re not just reporting on numbers; you’re gathering the intelligence you need to fuel your next big move.
Alright, let's get our hands dirty and build this thing. A killer social media report isn’t just a pile of numbers; it's a story. It’s the narrative that showcases your hard work, turning data points into a compelling tale of growth, engagement, and real business impact. We're going to build it section by section, making sure every single part has a job to do.
Honestly, structure is everything. A messy, confusing report is a fast-track to the trash folder. But a report with a logical flow? That guides your boss or client from the big-picture summary right down to the nitty-gritty details, making your wins impossible to ignore. A great template combined with a powerful tool like the Trendy iOS application makes this process seamless.
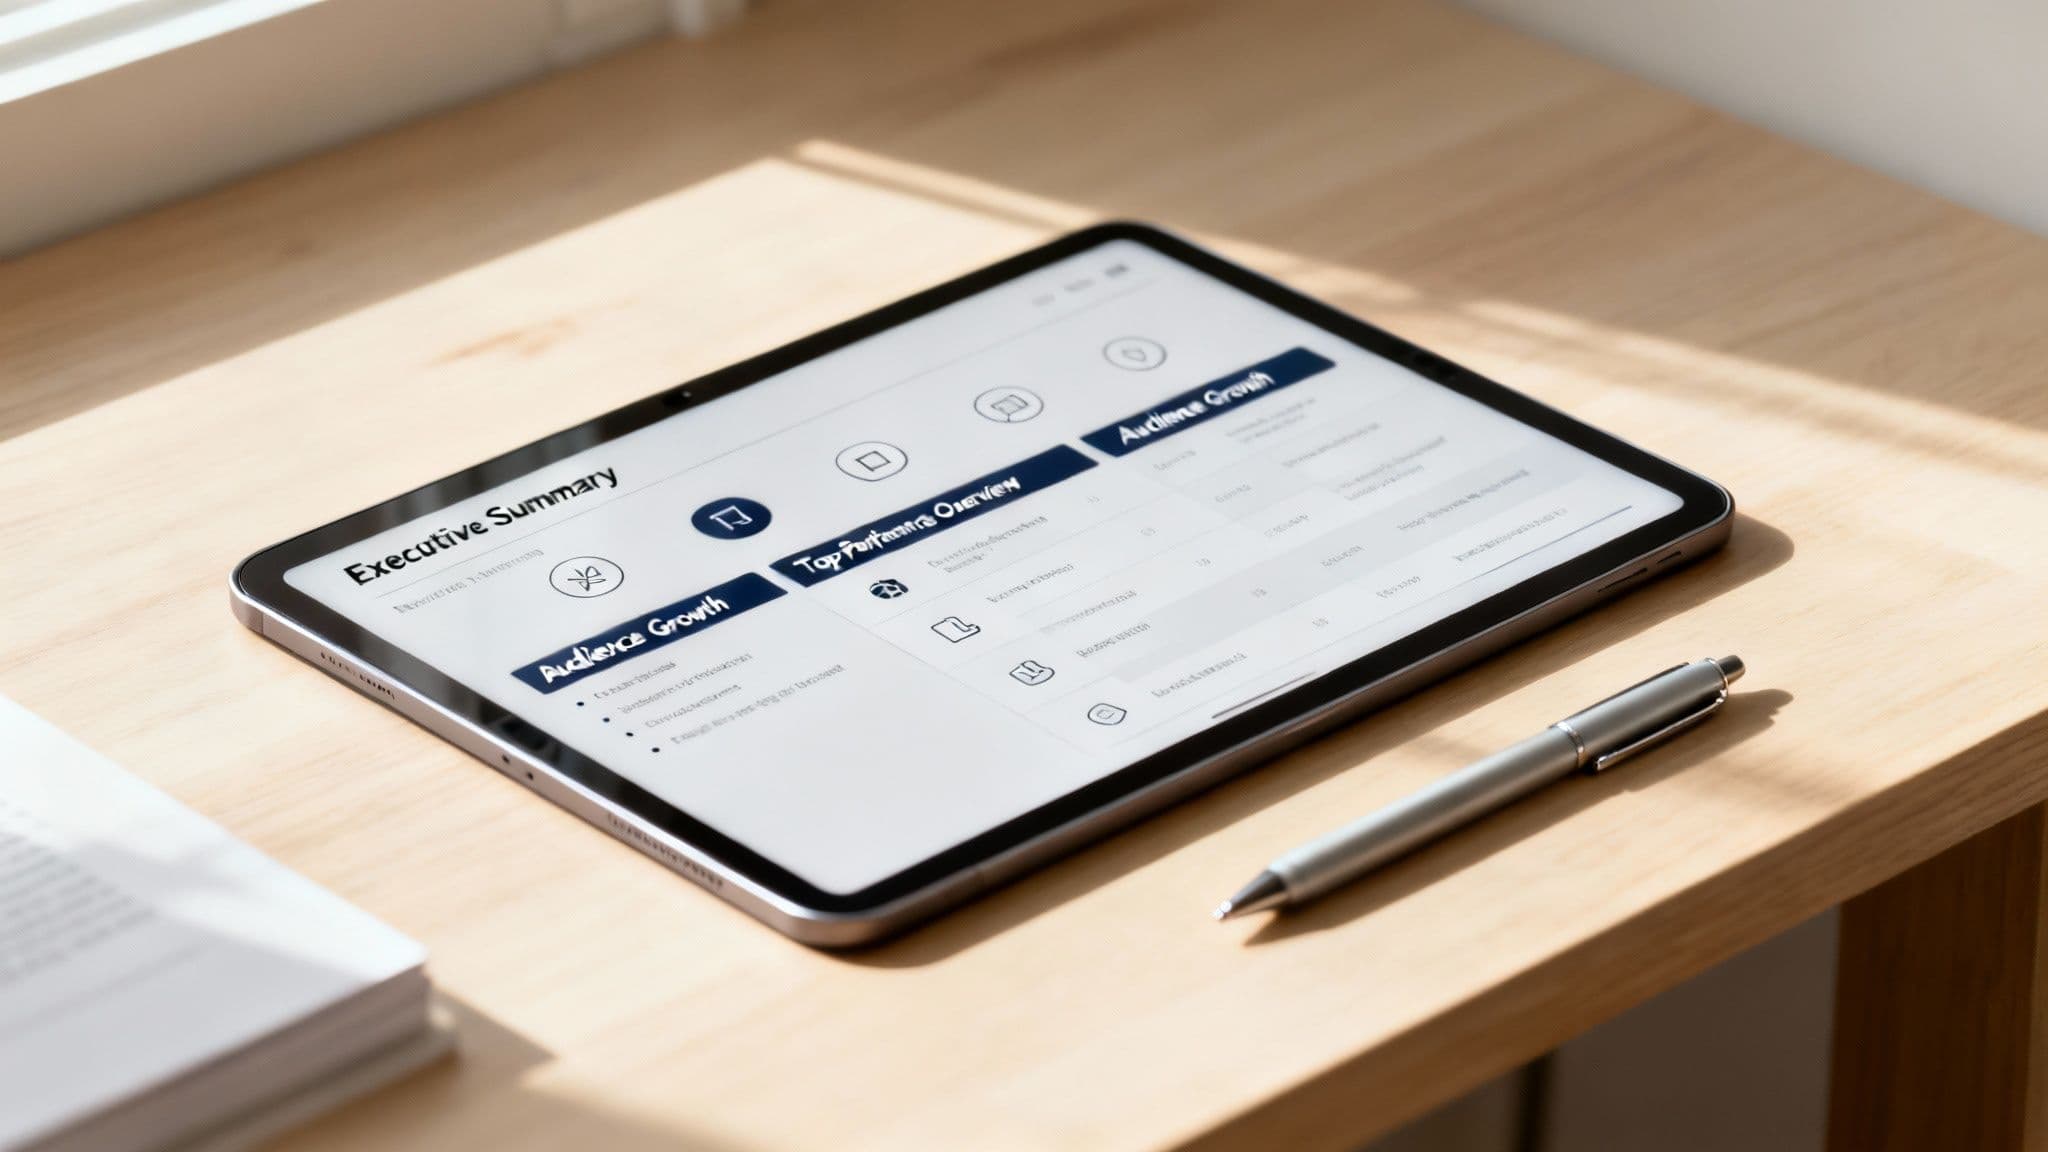
Every solid report I've ever built starts with an Executive Summary. This is your 30-second elevator pitch, your "here's what you need to know" in a nutshell. It's a tight little paragraph that sums up the entire period, calls out the biggest wins (like, "Smashed our engagement goal with a 15% increase"), and flags the most important takeaways. Keep it short, punchy, and to the point. No fluff allowed.
Right after that, drop in a Performance Overview. This is your command center dashboard, showing the top-line metrics across every platform at a glance. Think total follower growth, overall engagement rate, and total reach. It gives stakeholders that quick, high-level snapshot before they dive any deeper.
Your goal is to make the most important information impossible to miss. The first page of your report should tell someone everything they need to know, while the following pages explain how and why it happened.
Now we get to the good stuff: the Platform Deep Dives. This is where you break things down channel by channel—Instagram, TikTok, X, you name it. But please, don't just dump a wall of numbers. You have to customize the metrics to what actually matters on each platform. It shows you know what you're talking about.
And if you’re running paid campaigns, you’ll need a whole different set of metrics. This foundational guide to Facebook Ads Manager reporting is a great starting point for building out that side of your template.
Two sections that really make a report sing are Top-Performing Content and Audience Growth. The first is your highlight reel. Don't just list the posts with the most likes. Include screenshots of your bangers and, more importantly, explain why they worked. Was it the hook? The trending audio? The hilarious caption? To really nail this, you have to get good at spotting patterns. Our guide on how to analyze content performance can help you connect those dots.
The Audience Growth section is so much more than a follower-count graph. This is where you talk about demographic shifts, where your new followers are coming from, and how their sentiment is changing. Are you attracting the right people? Are they sticking around and engaging?
This is where a tool like the Trendy iOS application becomes your secret weapon. You can pull super-accurate demographic and engagement data right from Trendy’s profile insights to flesh out this section. Even better, its real-time stats and post idea generator mean you can spot your best-performing content instantly and get inspiration for your next hit. It turns your template from a static document into a dynamic strategic tool, all backed by data you can actually trust.
Okay, so you've built a killer template. That's a huge win! But manually punching in numbers every week or month? That gets old, fast. Let's be honest, it's a grind. True efficiency—the kind that gives you back hours to actually be creative—is all about automation. It’s time to let the right tools handle the grunt work so you can focus on the big picture.
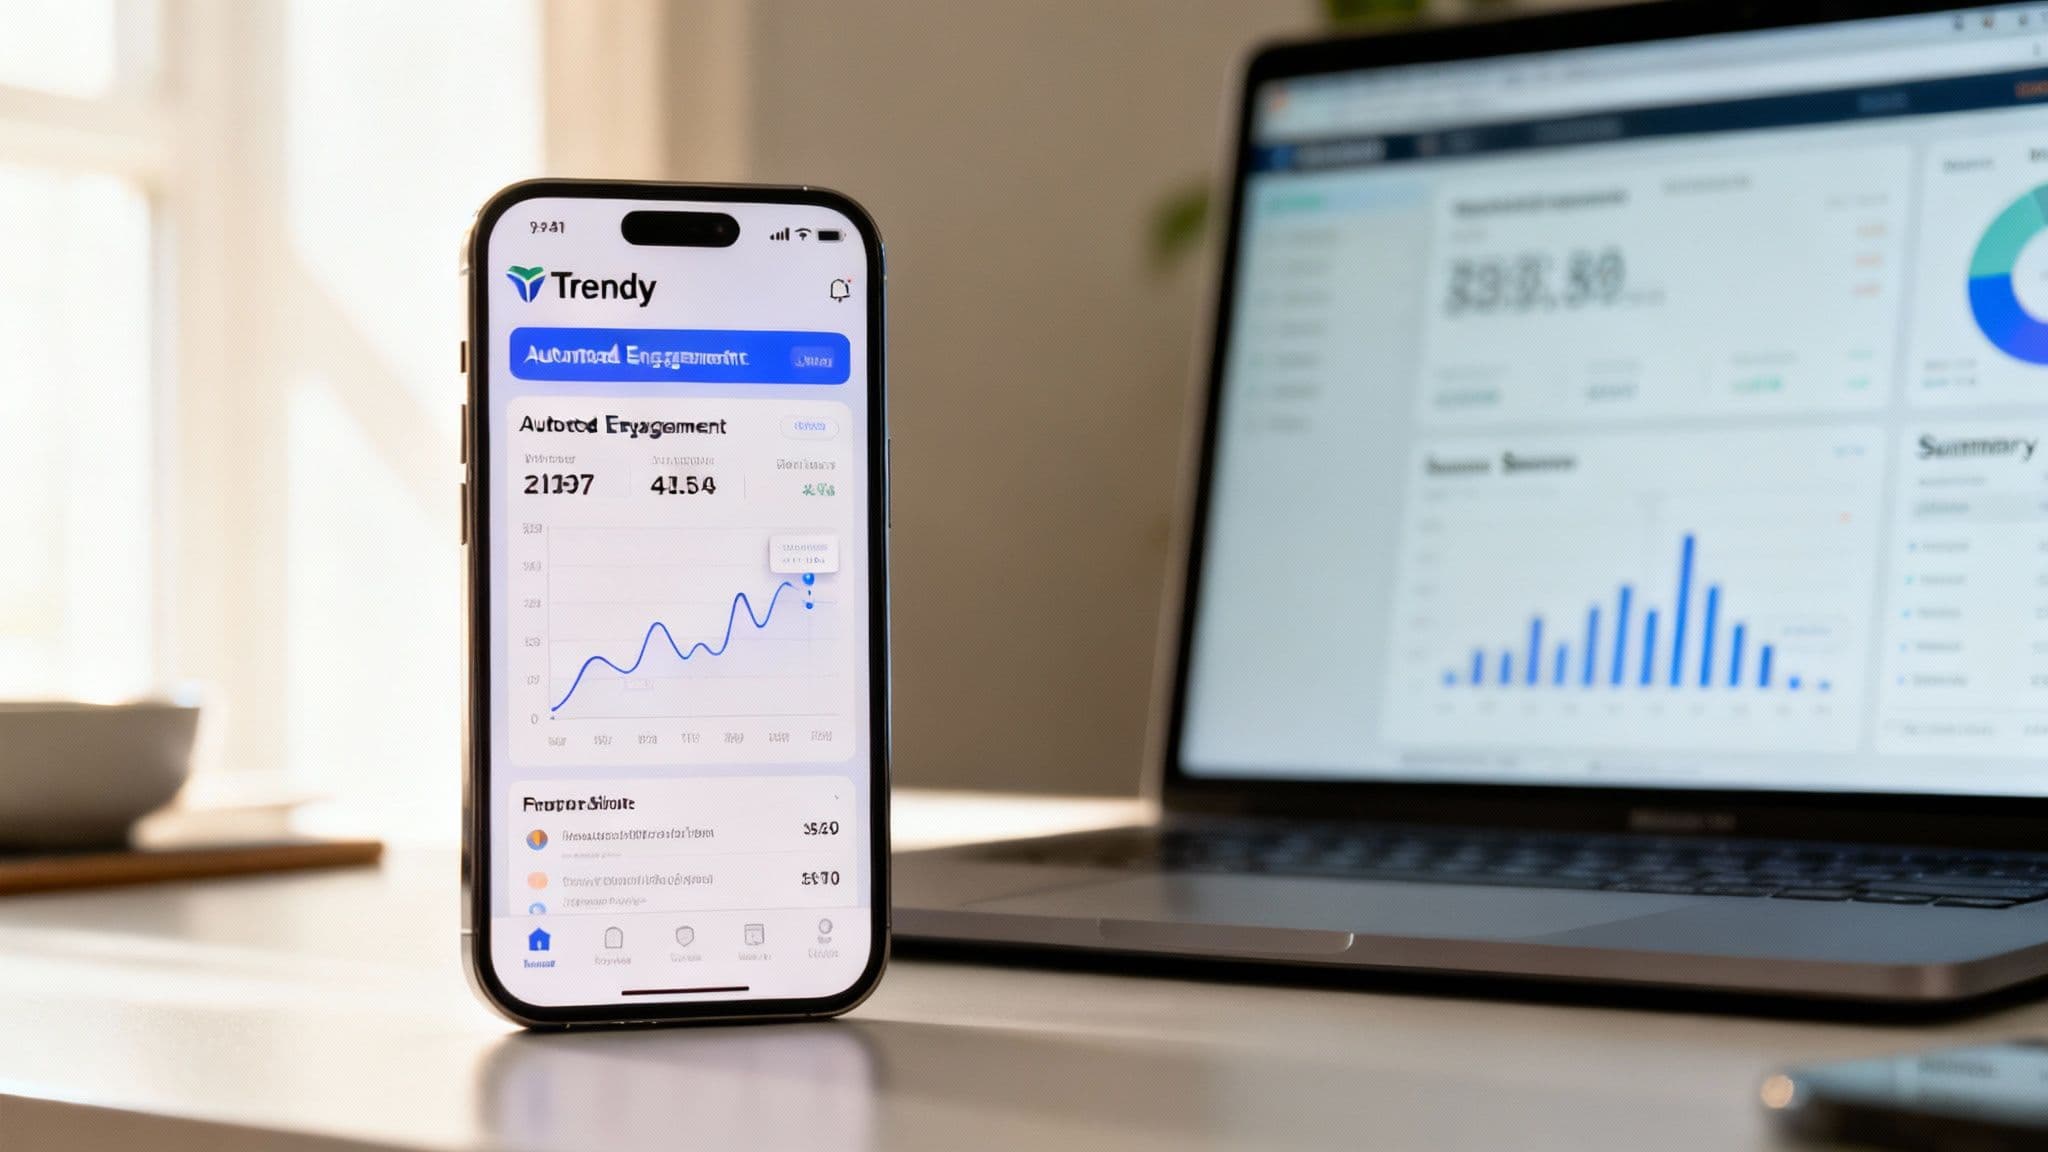
Look at how a purpose-built app like Trendy serves up complex analytics in a clean, visual way. This is the difference between spending hours digging through confusing native platform analytics and getting what you need at a glance. It's painless.
Sure, you can cobble together some basic automation with Google Sheets or even Airtable, but they just can't hang with specialized apps built by and for creators. This is where a platform like the Trendy iOS application enters the chat and completely changes the game. It’s not about just pulling raw numbers; it’s about serving up meaningful insights you can actually use.
Picture this: your social media report practically fills itself out. That's not a fantasy. Trendy makes it happen with a toolkit designed to cut out the guesswork and streamline your entire process. Instead of losing half a day hunting for data points, you get everything you need in minutes, right from your phone.
Here are a few creator-focused features that make your life easier:
The smartest social media reporting template is only as good as the data you feed it. Automation tools like Trendy make sure that data is accurate, timely, and packed with strategic gold.
The difference is night and day. We've seen that teams who integrate their templates with proper analytics platforms can cut their manual data entry time by 50% and generate reports 35% faster. That’s a massive win. For some eye-opening stats on this, Hootsuite breaks down social reporting insights pretty well.
Let's walk through a real-world example. You’re a lifestyle creator, and it’s time to pull your monthly report. The old way involved a dozen browser tabs and a pounding headache.
The new way? You open the Trendy iOS app.
You pop over to your profile insights, grab a screenshot of the engagement graph from the last 30 days, and immediately notice that Reels using trending audio brought in 40% more saves than your other content. Boom.
That single insight is pure gold. You drop it into your "Top-Performing Content" section, add a quick note to lean into trending audio next month, and you're done. The whole thing takes less than five minutes. You've just saved yourself hours of mind-numbing work and avoided the silly mistakes that creep in when you're tired and bored. The Trendy iOS application gives you this power back.
If you want to explore more platforms that can help you work smarter, not harder, check out our guide on the best social media analytics tools. It’s all about finding the right gear for the job.
Let's be brutally honest. Your data can be pure gold, but if it’s buried in an ugly, confusing document, nobody is going to care. Brilliant insights are totally useless if they put your audience to sleep. This is where we stop crunching numbers and start telling a visual story. The mission? To build a social media reporting template that doesn't just inform but actually wows people.
There's a reason the market for these tools is blowing up. Projections show the global market for social media analytics and reporting tools is set to hit a whopping $2.3 billion by 2026. And get this: a huge 60% of users prefer downloadable templates they can tweak themselves. This just proves how much creators and brands value a polished, professional look. You can dive deeper into the trends in social media reporting templates to see why looks really do matter here.
Before you even touch a chart, let's talk branding. A report that looks like it came from your brand instantly screams authority and professionalism. It's a simple move that makes a massive difference.
This isn't just about making things look pretty. It's about reinforcing your brand identity and making your hard work look as sharp as the insights inside.
Listen, not all charts are created equal. Using the wrong one can turn simple data into a confusing mess. The secret is to match the chart type to the story your data is trying to tell.
Your report’s design should do the heavy lifting. A great visual explains a complex trend in seconds, making your strategic value crystal clear without you having to say a word.
For example, trying to show follower growth over the last quarter? A line chart is your best friend—it’s perfect for illustrating trends over time. But if you're comparing engagement rates across Instagram, TikTok, and X, a bar chart is the undefeated champion for those side-by-side showdowns.
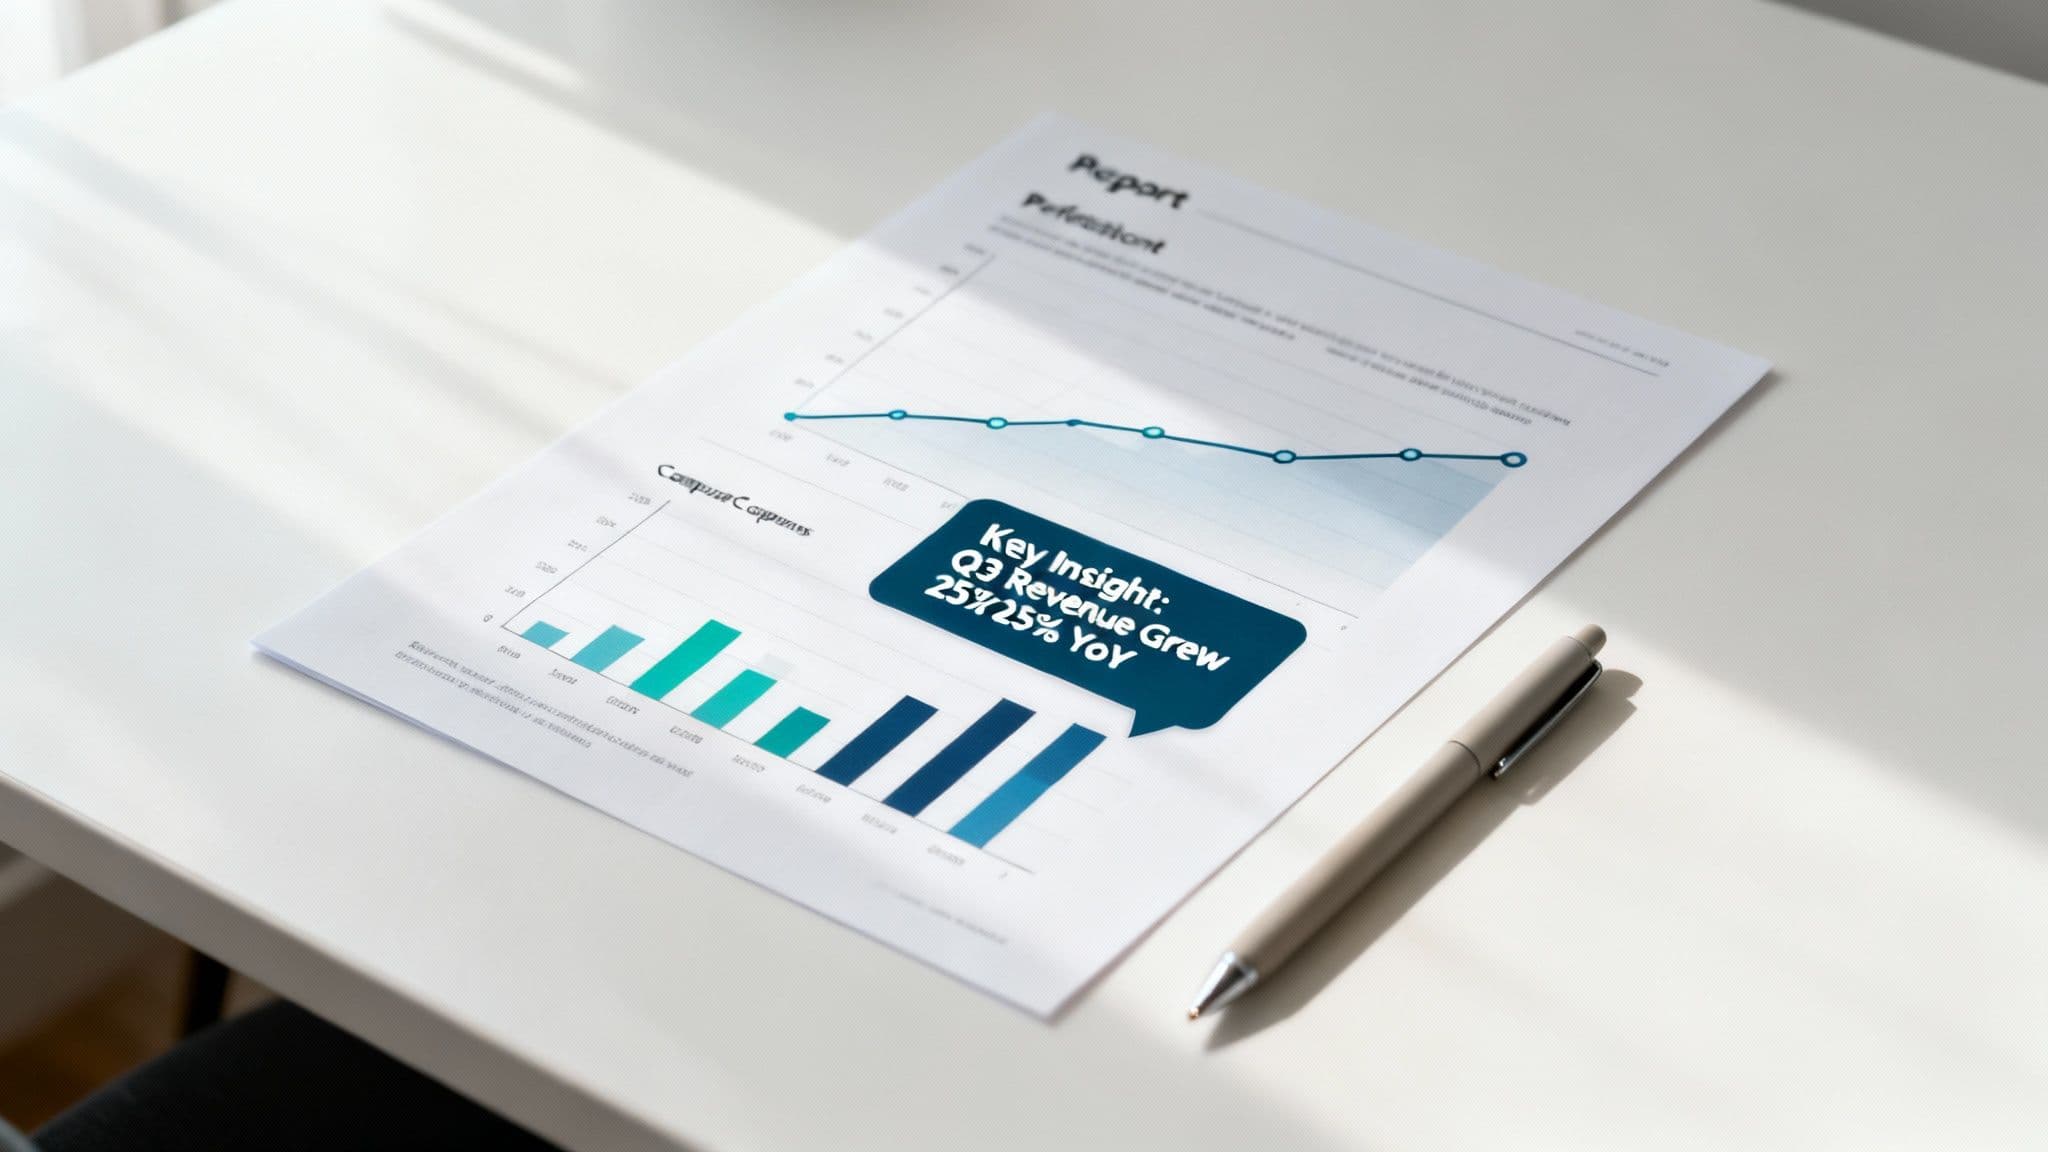
And for the love of all that is holy, do not just dump a raw data table into your report. Turn that data into a clean, compelling graphic. Use big, bold call-out boxes to highlight the most electrifying wins—like "+500% Reach on Reels This Month!"—so your boss or client can't possibly miss them.
As a content creator, getting these visuals has never been easier. The Trendy iOS application automatically generates beautifully designed charts and graphs for you. You can literally screenshot these clean visuals directly from the app and drop them right into your report. It’s an instant upgrade with zero design effort required. What a brilliant way to make your data pop and prove your strategic genius.
You're putting in the work to build the perfect social media reporting template, and naturally, some questions are bound to pop up. Let's clear up some of the common ones so you can get back to what you do best: creating amazing content.
For most creators, pulling a report once a month is the Goldilocks zone—just right. It gives you enough time to see real trends take shape, letting you zoom out from the daily noise and focus on what's actually moving the needle toward your goals.
Now, if you're in the heat of a major campaign or launching something new, you'll want to kick things up a notch. Shifting to weekly reports during these intense periods is a total power move. It lets you pivot quickly, tweaking your strategy based on what the data is telling you in near real-time. Think of your quarterly reports as the big-picture strategic huddles. The most important thing? Just be consistent. Pick a schedule and own it.
Let's break it down. A dashboard is your car's speedometer; you glance at it for a quick, live reading of what’s happening right this second. It’s for daily monitoring and quick checks. A tool like the Trendy iOS application provides a powerful, real-time dashboard for creators.
A report, on the other hand, is the story of your road trip. It’s a carefully crafted look back at a specific time frame—say, the last 30 days—that tells you why things happened. It adds context, pulls out the "aha!" moments, and lays out what you should do next. You use a dashboard to see if a post is getting likes, but you use a report to explain why your overall engagement went up 15% and how you're going to replicate that success.
Yes and no. You can absolutely create a "master" template that covers the basics—the executive summary, the key highlights, the overall performance. That’s smart.
But you'll definitely need to customize sections for each platform. The metrics that make or break your success are different everywhere you go. A "Retweet" on X is a world away from a "Save" on Instagram, but both are crucial engagement signals on their home turf.
The best approach is to have your main overview, then create dedicated deep-dive sections for each network. This is where a tool like Trendy is a lifesaver. It neatly pulls all your data from different platforms into one spot, making it way easier to grab the specific metrics you need for each part of your report.
Ah, the ROI question. This is where you turn your creative wins into business impact. The most straightforward way is to track conversions. By using UTM parameters in your links, you can directly trace website clicks, sales, or email sign-ups back to a specific post or platform.
But what if direct sales aren't your main goal? You can still show massive value. Track things like your cost per lead, how much website traffic from social you're driving, or the increase in brand mentions. With the analytics inside the Trendy iOS application, you can see exactly which pieces of content are getting people to visit your profile and click your links, drawing a clear line from your creativity to real-world results.
Ready to stop guessing and start growing with insights you can actually use? The Trendy app acts like a personal content strategist in your pocket, serving up real-time analytics and fresh post ideas. Download the Trendy iOS application today and turn your social media reporting from a chore into your secret weapon.
