
Power your content analysis with the Trendy iOS app, the AI-driven analytics companion for creators on the go.
Understanding how your audience interacts with each post is more than just glancing at numbers. It’s about spotting patterns, celebrating wins, and course-correcting quickly when something falls flat. Think of it as reading your readers’ minds—and the secret weapon is a clear set of metrics.
Begin by choosing key performance indicators that matter for your goals:
Each one tells a different story, so you can zero in on what’s working and what needs a refresh.
Page views can feel like a vanity metric, but without reach, nothing else matters. If views plateau, try tweaking headlines or distribution channels.
When people stick around for two minutes or more, you know your content resonates. If your average time on page dips, break up text with visuals or punchy subheads.
A high bounce rate often signals a mismatch between expectation and reality. Double-check that your headline delivers exactly what you promise.
Social shares are pure gold. They show organic interest and push your work into new circles. Spice up share buttons and experiment with memorable quotes that readers want to tweet.
Conversion rate bridges the gap between engagement and actual business results. A small boost here can move the needle on revenue and sign-ups.
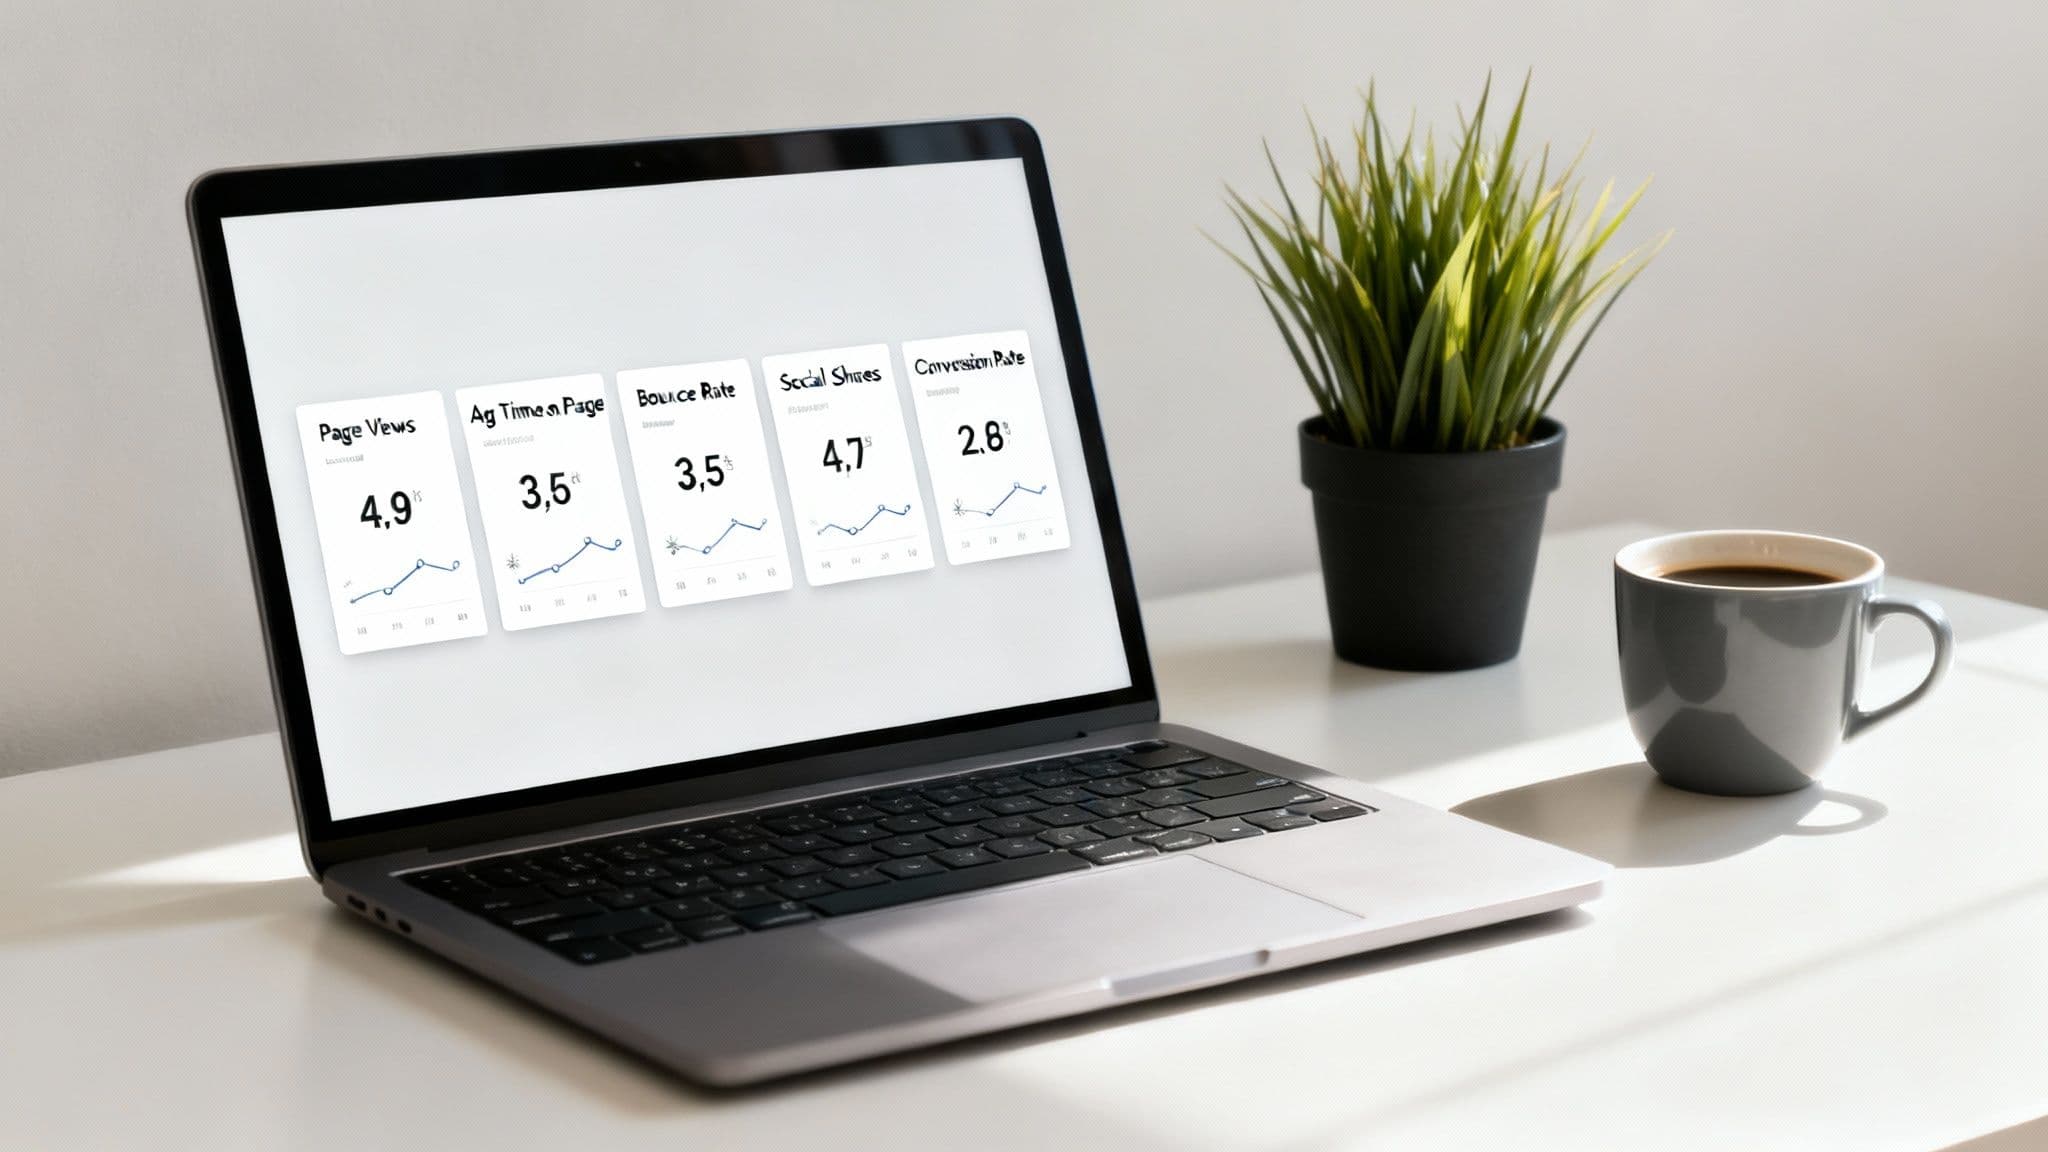
Here’s a snapshot of these core indicators:

That visual drives a simple truth: When you optimize for conversions, you often see lifts across the board.
Nobody has time to manually compile spreadsheets. Instead, tap into these reliable platforms:
Before you dive into deep analysis, let’s put everything side by side.
Whether you’re auditing last month’s campaign or planning your next epic post, this table helps you see each metric’s role at a glance.
| Metric | Purpose | Recommended Tools |
| Page Views | Measure overall reach | Google Analytics, Trendy |
| Average Time On Page | Gauge reader engagement | GA4, Trendy |
| Bounce Rate | Assess content relevance | Google Analytics |
| Social Shares | Track organic amplification | Native Platform Insights |
| Conversion Rate | Evaluate campaign performance | GA4, Trendy, CRM Dashboards |
Pinpointing the right mix of metrics turns guesswork into a clear action plan.
Keep your eye on these numbers each morning. That ritual, more than any single tactic, will sharpen your content game and grow your audience steadily.
Imagine inviting a crowd to your talk, only to hear silence when you ask for questions. High traffic without engagement feels exactly like that. While page views hint at curiosity, they don’t tell you if your audience actually stayed for the show.
Crunching multiple data points brings clarity. Instead of staring at raw numbers, focus on the actions that signal real interest.
Consider these core metrics:
If you want to dive deeper, Learn more about these metrics on ScheduleThreads
The Trendy iOS app takes the grunt work off your plate. It pings you with daily alerts on engagement peaks, benchmarks your performance against competitors, and even suggests your sweet spot for posting times.
When readers linger beyond two minutes, you know something’s clicking. But when the Bounce Rate soars above 70%, it’s a clear sign that your content missed the mark.
Want to see how your Instagram efforts stack up?Check out our guide on calculating Instagram engagement rates
When people share your posts, they’re vouching for your message. Referral traffic, on the other hand, points to the platforms and partners that really move the needle. To shift from vanity metrics to real impact, explore how to measure social media success and dig into actionable insights.
Trendy’s share-analysis feature cuts through the noise, revealing which hashtags and posting windows sparked the biggest response. You can even set up instant alerts for share spikes or referral surges.
Key InsightA low bounce rate paired with high shares often predicts slower but more qualified conversions.
Spotting these patterns helps you tweak headlines, swap visuals, or rework CTAs—little changes that can drive major ROI improvements.
Download Trendy on App Store for AI-driven reports and personalized tips that turn your data into a growth engine.
Building a solid data pipeline is like laying the foundation for a house—it has to be rock-solid. I’ve found that combining Google Analytics, each platform’s native insights, and an AI-powered dashboard paints a full picture of how people engage with your content.
Start by dropping tracking snippets and custom event code onto your site and profiles. This ensures everything from a tap on a video play to a thread of comments shows up in your reports.
Imagine you want to see YouTube watch time side by side with TikTok engagement. By setting up filters and segments, you isolate each content type without the noise.
In Google Analytics 4, I create custom events for button taps, form submissions, even link clicks. That lets me trace exactly which pieces push viewers deeper into our funnel.
Then I link everything into Trendy. Suddenly, I’m not bouncing between tabs—I’ve got it all in one view, ready to act on.
Key TakeawayMerging multiple analytics sources into one dashboard uncovers insights you might otherwise miss.
Globally, content performance often boils down to engagement: likes, shares, comments, time on page. In fact, 53% of marketers track these interactions to guide their content choices. For more data-driven inspiration, check out the full content performance statistics.
You might also like our guide on the best social media analytics tools.
Once your metrics feed into Trendy’s report builder, arranging insights feels like playtime. Drag traffic graphs, engagement charts, and conversion tables until the story leaps off the page.
Pro tip: Pin the highest-performing posts at the top of your dashboard. It’s an easy way to spot spikes and steer your next campaign.
Seeing a dashboard full of metrics is just the start. When you notice a sudden spike or a lull, you’ve actually unearthed a clue about what’s working (or what isn’t). Turning those raw figures into clear insights points you toward your next winning idea.

Here are a few quick signals to watch for:
Tracking page views, session duration, and social shares over time reveals what truly resonates. For example, our detailed how-to guides held attention 35% longer than short listicles last quarter. That insight nudged us to dive deeper into long-form tutorials.
Comparing your week-over-week results shines a light on consistent trends—and any surprises. If you want to hone the art of turning data into strategy, check out mastering Facebook Ads Reporting.
Key InsightMonitoring shifts in your top formats helps you jump on audience preferences before they shift again.
Sometimes the smallest tweak delivers the biggest payoff. I once changed just one word in a headline and saw a 22% boost in click-through rate.
Industry-wide research even shows content marketing generates 7.65 earned for every 1 spent. For the full rundown, explore SQ Magazine's Content Marketing Statistics.
When a post starts to lag, breathe new life into it:
Don’t forget to automate your reporting with the Trendy iOS application. It pulls your key metrics together and even pushes AI-powered tips straight to your phone.
Actionable TipIf traffic dips, experiment with format first—adjusting length or media type often doubles engagement.
Interpreting your analytics isn’t a one-off task. It’s an evolving practice that sharpens every piece of content you create. Keep digging, keep testing, and enjoy watching your efforts pay off.
Imagine a boutique online store eyeing more email subscribers. They dove into click-through patterns and saw sign-ups climb by 50% in just weeks.
By tapping into Trendy’s automated insight reports, they pinpointed where readers drifted away and rewrote their blog intros with sharper hooks. The result? Headlines that grabbed attention and kept visitors scrolling.
That simple rhythm—spotting a winner, iterating fast—turned tentative visitors into eager subscribers almost overnight.
A nonprofit story adds another layer. They monitored email open rates and scroll-depth in Trendy’s dashboard, then shifted their donation ask to the spot where reader interest peaked. Donations jumped by 30% over two months.
“When you see readers clicking donate at a specific point, you know where to add your ask,” one campaign manager shared.
These tactics turn dry numbers into clear actions—no guesswork required.
For a deeper dive into social media returns, check out our guide on measuring social media ROI.
Beyond case studies, Trendy’s iOS app brings sentiment analysis and competitor benchmarks right to your phone. Schedule posts when your audience is most active, then export polished dashboards for stakeholders.
Real-time notifications flag underperforming posts or emerging trends—so you react faster and keep that momentum going.
In one week, I noticed a referral spike on LinkedIn Stories. I mirrored that format for Instagram Reels, and views jumped by 22%, with a slew of new followers tagging along.
Ready to turn raw data into your next big win? Download Trendy on the App Store and let those in-depth reports guide your campaigns.
Keep revisiting these case studies, refine your messaging as new patterns emerge, and lean on those mobile insights for continuous growth.
Ever stared at endless metrics and wondered what really clicks? The moment you connect Trendy App to TikTok, Instagram, and your other channels, the guesswork vanishes. It stitches together raw data and AI-driven context, so you see the story behind every like, comment, and share.
Daily summaries pop into your inbox with highlights on spikes, drops, and the audience reactions that matter most. No more scrolling through spreadsheets—Trendy flags the surprises and celebrates your wins.
Key Trendy Features:
All of this frees up hours in your week—time you can spend testing new ideas or polishing your next big post. Just pop into the Profiles tab, link your accounts, pick a KPI set and date range, and watch a crystal-clear report appear in moments.
Want to know the instant a video goes viral? Trendy’s alerts have got you covered. You’ll get a ping when views spike or sentiment shifts, so you can celebrate momentum or tackle issues before they escalate. No deep dives required—just timely nudges to stay on top of your performance.
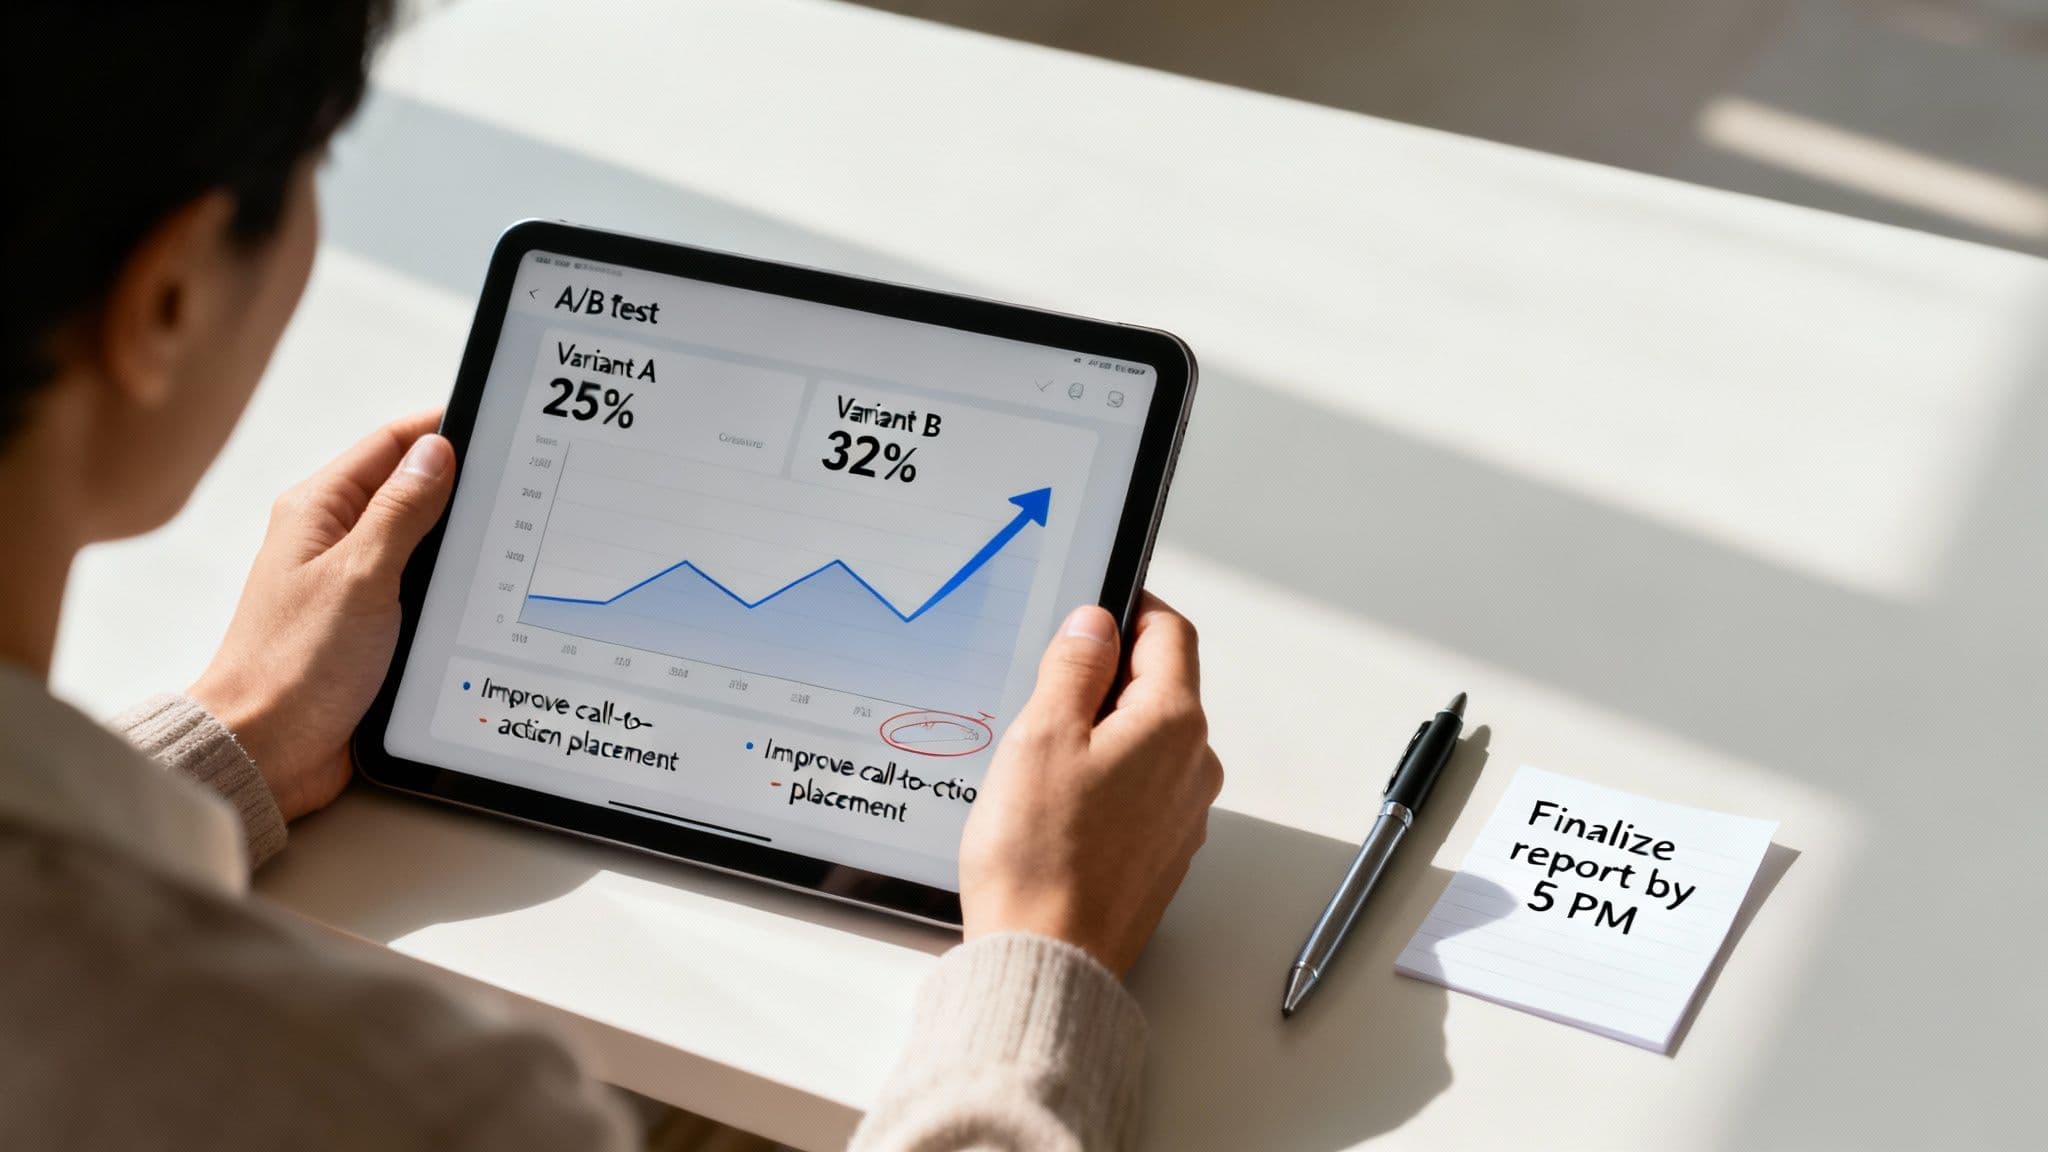
In the example above, you’ll notice a 15% engagement jump around midweek, followed by a lull on Friday. That kind of insight sparks actionable ideas fast.
Behind every data point, there’s a lesson. To dig deeper:
Key TakeawayChecking peer performance weekly helps you ride emerging trends before they peak.
Whether you’re tracking watch time, shares, or sentiment swings, Trendy turns raw figures into clear next steps.
| Report Method | Time Spent per Week | Key Benefit |
| Manual Spreadsheets | 4+ hours | Prone to errors |
| Trendy App | 30 minutes | Real-time AI insights and stakeholder-ready |
A side-by-side look like this shows how Trendy carves hours off your reporting process without sacrificing accuracy.
Pro Tips For Getting The Most Out Of Trendy:
Ready to turn daily data into strategic moves? Download Trendy on the App Store and start refining your content playbook today.
Lots of creators ask which figures really tell the story behind their social posts. Below, you’ll discover straightforward answers and hands-on advice to sharpen your analytics skills fast.
When your Engagement Rate climbs while Page Views stay level, it’s a solid hint that your audience is finding real value in what you share.
Quick TipPinpoint two or three metrics that align with your goals—and treat them as your north star.
Mixing these views keeps you agile—reacting quickly when needed and avoiding the trap of data overload.
Most creators start with platforms like Google Analytics and built-in social insights. They’re great for:
On the flip side, they often lack advanced segmentation and context that can unlock deeper understanding.
Trendy takes the guesswork out of daily tracking by offering:
With Trendy, everything from spotting a viral hit to presenting quarterly results feels effortless.
Ready to make smarter content decisions? Download Trendy on the App Store: https://apps.apple.com/us/app/trendy-profile-insight-report/id6754564423
