Forget vanity metrics. If you want to know what really matters on Instagram, you need to look past your follower count. The real MVP is your engagement rate, and an Instagram engagement rate calculator is the tool that tells you the score.
Think of it as the pulse of your account. It reveals how many of your followers are actually paying attention, interacting, and—most importantly—care about what you’re putting out there.
Let's be real for a second. An account with 10,000 followers who are actively liking, commenting, and sharing can be way more powerful (and profitable) than an account with 100,000 followers who are just silent scrollers. That’s because a high engagement rate is a massive signal to the Instagram algorithm that your content is gold.
When people interact with your posts, it tells the algorithm that what you're sharing is valuable, which kicks off a beautiful cycle of boosting your organic reach.
Instagram's main goal is to keep people on the app. It does that by showing them content they'll actually enjoy. When your posts start racking up likes, comments, shares, and saves, you're basically telling the algorithm, "Hey, people dig this!"
What happens next? Your content gets a VIP pass to better visibility.
It's a powerful feedback loop. More engagement gets you more reach, which brings in new followers and, you guessed it, even more engagement.
A strong engagement rate isn't just about numbers; it’s social proof. It shouts to brands, potential customers, and new followers that you've built a real, thriving community that's worth being a part of.
It's no secret that getting seen on Instagram is harder than it used to be. The platform is crowded. Recent data paints a pretty clear picture: the average engagement rate across all post types fell to about 0.45% in early 2025.
That’s a steep 24.1% drop from the previous year, mostly thanks to a flood of new content and algorithm changes that are squeezing organic reach.
This is exactly why you need to be obsessed with your numbers. A solid engagement rate isn't just a bonus anymore—it's essential for survival. Keeping a close eye on this metric is the only way to know if your content is actually connecting and is the first step in truly measuring your social media ROI.
For any serious creator or brand, using an Instagram engagement rate calculator isn't just a good idea; it's a fundamental part of the game.
Before you jump straight to an automated tool, let’s get our hands dirty with a little old-school math. Seriously. Knowing how to calculate your engagement rate by hand gives you a gut feeling for what the numbers actually mean.
It’s like learning to make a perfect espresso shot before you buy a fancy, fully automatic machine. You learn to appreciate the nuances, and you’ll know instantly when something’s off.
There are two main formulas people throw around, and honestly, they tell very different stories about your content. The one you choose depends entirely on what you're trying to figure out. Are you measuring the loyalty of your ride-or-die followers? Or are you trying to see if a post has that special something to go viral?
First up is the classic: engagement rate by followers. This is your go-to for getting a baseline on your account’s overall health. It answers the question, "How many of my existing followers are actually paying attention?" It’s a great way to see if your content is consistently resonating with the community you’ve built.
Then there's the second, and in my opinion, more telling formula: engagement rate by reach. This one is a rockstar for judging how well a single post did. It tells you the percentage of people who actually saw your post and decided to take action. This is a much sharper indicator of a post's quality and its potential to break out beyond your current audience.
Think of it this way: Calculating by followers is like checking your account's long-term blood pressure. Calculating by reach is like taking its pulse right after a killer workout—it shows you the immediate impact and raw performance.
For a quick reference, here’s how the two formulas stack up.
| Formula Type | Calculation Method | Best Used For |
| Engagement Rate by Followers | (Total Engagements / Follower Count) x 100 | Measuring the loyalty and interaction level of your existing follower base. Great for overall account health checks. |
| Engagement Rate by Reach | (Total Engagements / Reach) x 100 | Assessing the performance of individual posts. Perfect for spotting content with viral potential. |
Both are valuable, but they serve different masters. One is for community health, the other is for content performance.
Alright, let's crunch some numbers with a real-world example.
Imagine a travel creator just dropped a Reel about a hidden beach in Thailand. The post is doing pretty well, and here are the stats from her Instagram Insights:
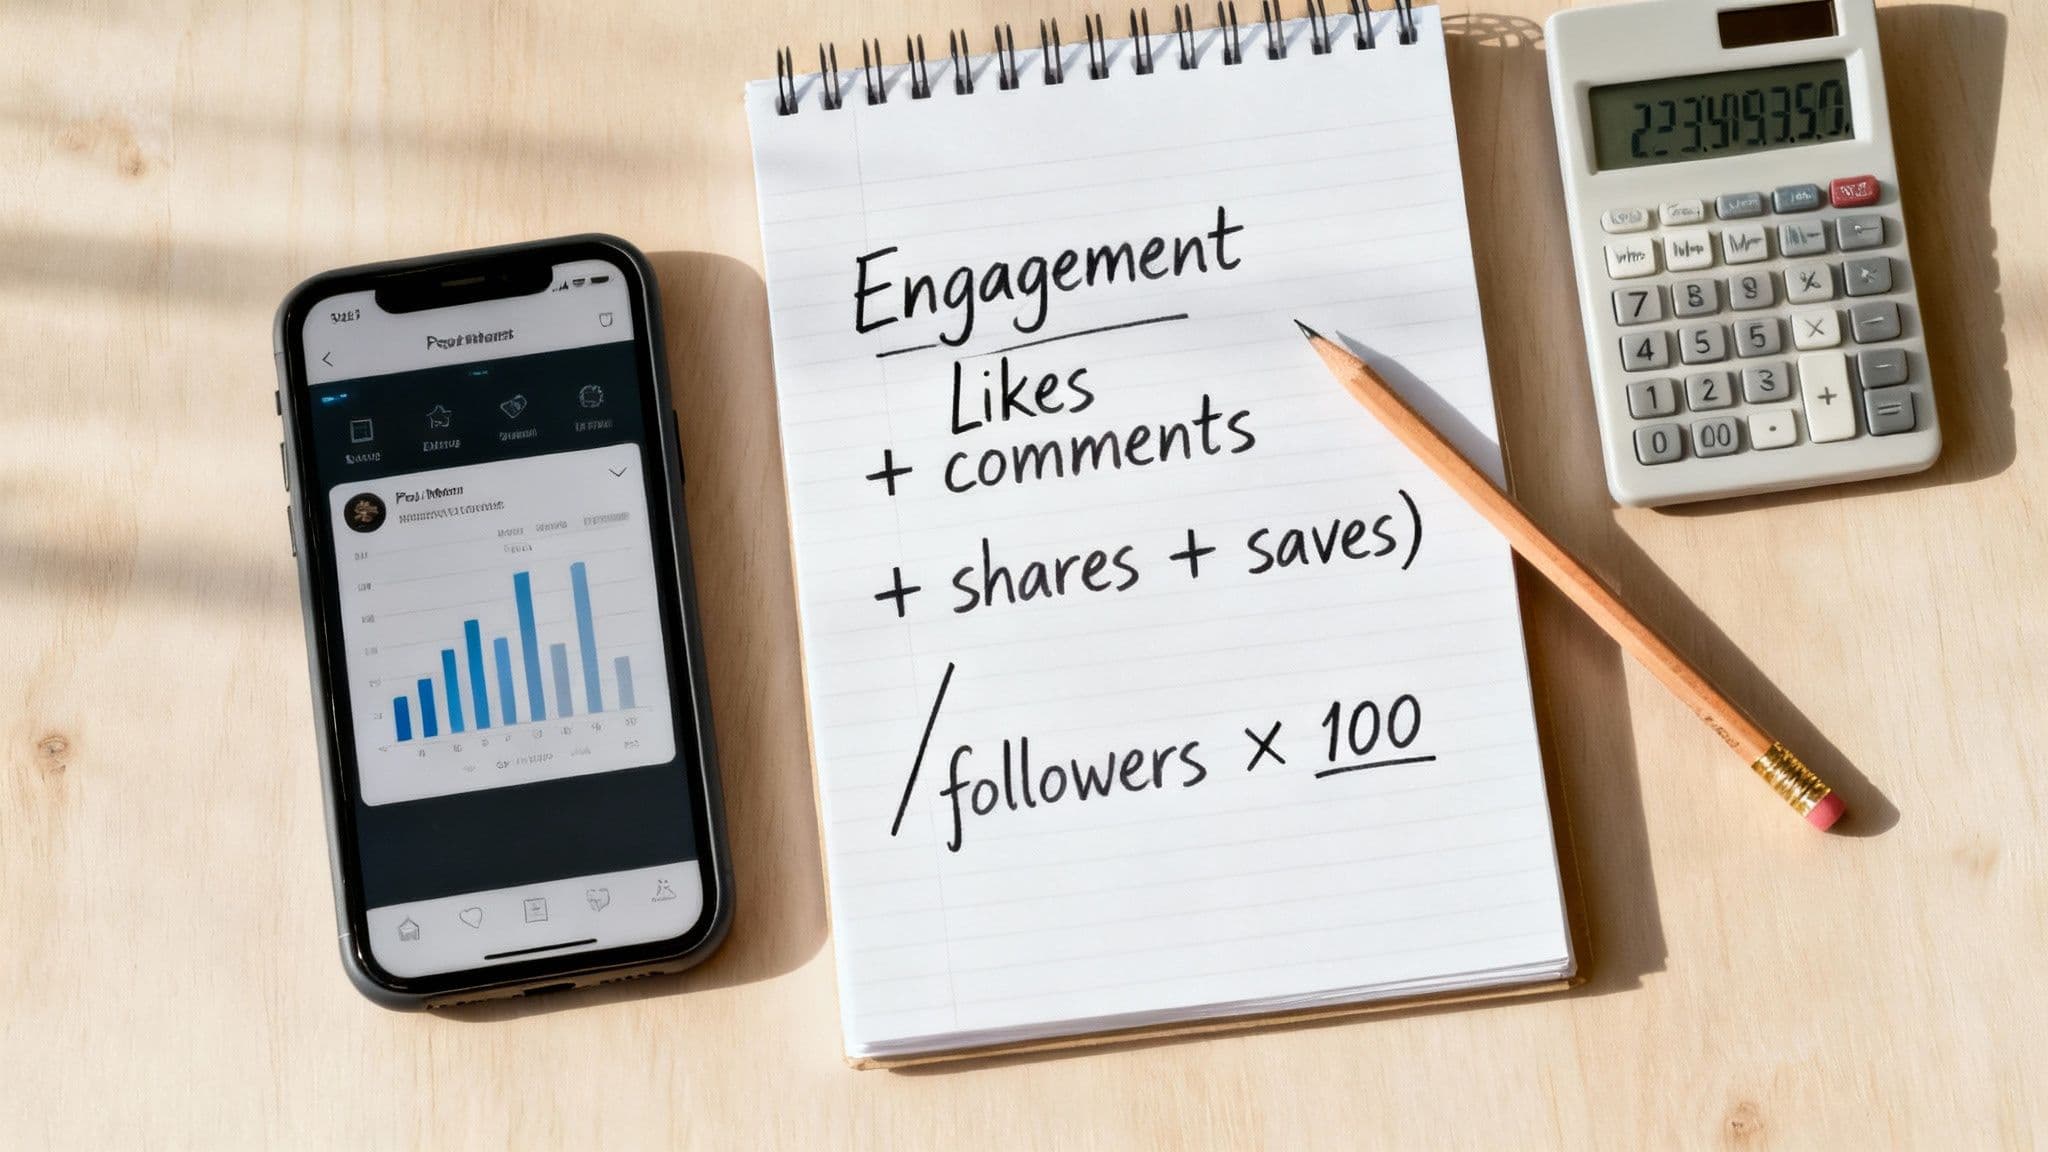
First thing's first, we need to add up all the interactions to get our total engagements.
Total Engagements = Likes + Comments + Shares + Saves Total Engagements = 850 + 75 + 50 + 125 = 1,100
Easy enough. Now, let’s plug that number into our two formulas.
That 9.17% is a fantastic number. It means this Reel was super effective, grabbing the attention of a huge chunk of the people who saw it—including a ton who weren't even followers. This is the scent of virality.
The 11% here tells a slightly different, but equally important, story. The post performed exceptionally well with her core community.
Sure, an Instagram engagement rate calculator can spit these numbers out in a millisecond. But knowing the "why" behind both calculations lets you interpret the results like a pro. One tells you about viral potential, the other about community loyalty. You need both to truly understand how to grow.
Alright, crunching the numbers yourself is a great way to get a feel for what’s really going on with your account. But let's be real—who has the time to do that every day? This is where a good engagement rate calculator saves the day. It's like having a little data-savvy assistant on standby.
Forget those basic, single-post calculators. The tools that will actually move the needle for your brand do so much more. They don't just spit out a number; they give you the story behind that number, track how you're doing over time, and even let you spy on your competition (ethically, of course). If you're a freelance social media manager, the right tool can literally turn hours of mind-numbing report-building into a couple of clicks.
When you're on the hunt, don't get distracted by shiny objects. The real magic is in the features that give you a clear, actionable snapshot of your performance. A top-tier Instagram engagement rate calculator should feel less like a spreadsheet and more like a strategic partner.
Here’s what I’d consider non-negotiable:
For example, this tool from Later has a clean, simple interface. You just plug in your numbers and get an instant result.
What I love about this is the immediate feedback. It’s perfect for a quick health check on a post without getting lost in the weeds of a full-blown analytics dashboard.
The truly powerful tools don’t just report on the past; they help you predict the future. Imagine a tool that not only calculates your engagement but also suggests what kind of Reel to post next based on what's blowing up in your niche. That's the idea behind platforms like our own, Trendy, which analyzes your industry to hand you proven content ideas on a silver platter.
Another killer feature? Comparing your performance against industry benchmarks. Knowing your rate is 3% is fine, but knowing it's double the average for your industry? That’s a powerful piece of context to bring to a client meeting or to inform your own strategy.
Your engagement rate is massively influenced by where your audience is and what industry you're in. A "good" rate in one country could be just "meh" in another. Regional benchmarks are everything if you're talking to a global audience.
The data backs this up completely. Back in 2022, the global average engagement rate hovered around 5.86%. But in Japan, the average was a staggering 11%—nearly double! This proves that a one-size-fits-all approach is a recipe for disaster. It's why sophisticated calculators that factor in these regional differences are worth their weight in gold. If you're curious, you can dive deeper into these regional engagement statistics to really get to know your audience.
So, you’ve done the math and have a number staring back at you. Is that 2% a reason to pop the champagne or a sign that your content strategy needs a serious rethink?
Here’s the thing: a "good" engagement rate isn't some magical, universal number. It’s a moving target, and what's great for one account could be a total flop for another.
Context is everything. A local coffee shop with 1,500 die-hard fans is playing a completely different game than a global sneaker brand with two million followers. Their goals, audience, and content are worlds apart, so why would their engagement benchmarks be the same? They shouldn't be.
One of the biggest factors that'll shape your "good" number is your follower count. It might seem a little backward, but smaller accounts often pack a much bigger punch when it comes to engagement.
It’s the classic case of quality over quantity. An account with 5,000 hyper-engaged followers who hang on your every word is often way more valuable to a brand than one with 50,000 who barely notice you. Smaller communities just breed stronger connections.
The field you’re in also sets the stage for what’s considered average. The education sector, for instance, often sees higher engagement—somewhere around 4.2%—because the content is naturally community-focused and easy to share. A B2B tech company, on the other hand, might have to work a lot harder for those likes and comments.
This infographic really drives home how much engagement rates can swing from one place to another.
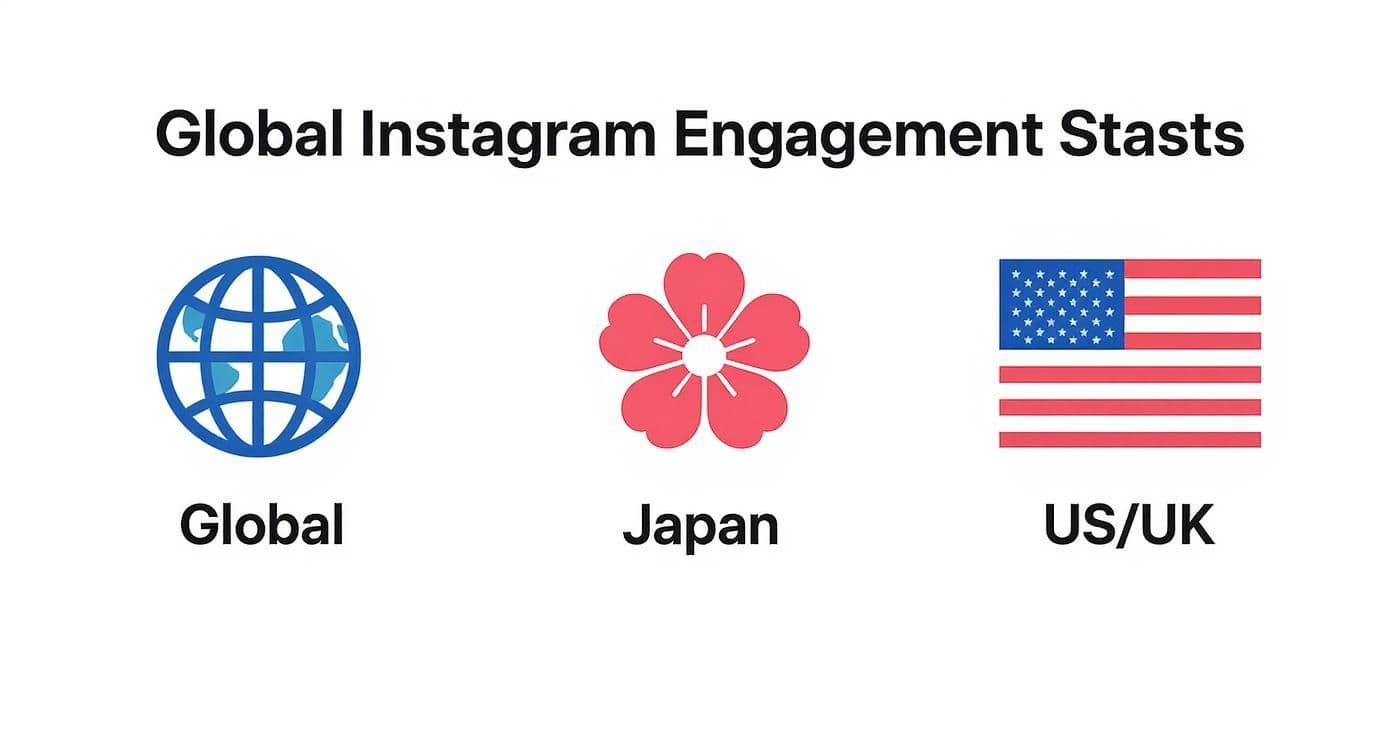
The data makes it crystal clear: where your audience lives plays a massive role in how they behave online, with some regions being way more interactive than others.
At the end of the day, the best benchmark you have is your own history. The real goal is to see steady improvement over time. Instead of obsessing over some mythical industry average, focus on creating content that genuinely connects with your audience.
And if you're looking for fresh ways to get more eyes on that awesome content, check out our guide on how to increase Instagram reach for some seriously actionable tips.

Alright, you’ve got your numbers from the Instagram engagement rate calculator. Now what? Staring at that percentage isn't going to make it grow. The real fun begins now—turning those numbers into a story of growth.
Forget the vague advice like "post consistently." Let's talk about the specific, trendy features that actually get people to stop their mindless scrolling and start tapping, commenting, and saving. This is your playbook for turning quiet lurkers into a buzzing, active community.
Instagram Reels are an absolute goldmine for engagement, but you have to play the game to win. The not-so-secret weapon? Trending audio. When you latch onto a sound that’s already going viral, you're essentially hitching a ride. The algorithm is far more likely to push your content out to a huge new audience that already loves the trend. Platforms like Trendy can even serve up trending audio suggestions on a silver platter, taking the guesswork out of finding the perfect sound.
It's a simple concept. A food blogger could post a recipe with some generic elevator music and get a few hundred views. Or, they could use a trending sound where the beat drops at the exact moment they slice into that gooey chocolate cake. Which one do you think is going to get shared?
Think of your Instagram Stories as a direct hotline to your most dedicated followers. And interactive stickers? They're your best friend for sparking conversations with zero friction. People love to weigh in with a single tap.
Here’s how you can transform passive viewers into active participants:
Likes and comments are nice, but saves are a power move. A save tells the Instagram algorithm, "Hey, this is so good, I need to come back to it." To rack up those saves, you need to write captions that are more than just a description—they need to be a resource.
Imagine a fitness trainer posting a carousel. Instead of a bland "Happy Monday, here's a workout," they title it "5 Common Squat Mistakes and How to Fix Them." That’s not just a post; it's a mini-guide people will want to save and reference later. For a deeper dive into making your multi-image posts work harder, check out this guide on mastering carousels on Instagram for engagement.
The big shift is from creating disposable content to building a resource library for your followers. Give them tips, tutorials, checklists, or inspiration they feel they can't afford to lose.
And these strategies aren't just clever tricks—they're essential in 2025. Instagram is a monster platform with over 2.6 billion monthly active users. Reels now eat up 39% of the average user's time on the app and generate double the engagement of photos. Leaning into these features isn't just a good idea; it's how you stay relevant.
When you start weaving these features into your strategy, you’re doing more than just chasing metrics. You’re building a genuinely dynamic and interactive community. For a broader look at what works across all social platforms, explore these battle-tested social media engagement strategies.
So, you've run the numbers through an Instagram engagement rate calculator and now you're staring at a percentage. What's next? If you're wondering what that number actually means and what to do with it, you're in the right place. Getting the data is easy; turning it into a real strategy is where the magic happens.
Let's tackle some of the biggest questions that pop up for creators and brands all the time.
This is a big one. My advice? Think in two different timeframes: the bird's-eye view and the on-the-ground view.
For the big picture, I recommend checking your overall account engagement rate about once a month. This gives you a clear, high-level look at your performance over time. It helps you spot larger trends and see if your strategy is paying off without getting lost in the day-to-day noise.
But for individual posts, you need to be way more agile. Check a post's performance after the first 24-48 hours. This is your immediate feedback loop. It's the quickest way to see what's hitting the mark right now, letting you double down on winning content formats and topics.
First off, take a breath. It happens to the best of us, and a sudden dip is usually a clue, not a crisis. Nine times out of ten, it’s a reaction to a specific change.
Did you try a new Reel style that just didn't land? Maybe you posted at a weird time and completely missed your audience's scroll session. It could even be something bigger, like a major Instagram algorithm update that shook things up for everyone. Put on your detective hat and look at your recent activity. A missing call-to-action or a caption that didn't ask a question can be enough to kill momentum. The key is to learn from it, not panic over it.
They absolutely do, but you have to measure them a bit differently.
Reels are straightforward. Since they live on your feed and function a lot like regular posts, you can use the same formula we've been talking about (likes + comments + shares + saves).
Stories, however, are their own unique world. Engagement here isn't about likes; it's about interactions. Think replies, sticker taps, poll votes, and quiz answers. You can calculate a rough Story engagement rate yourself with this simple formula: (Total Story Interactions / Total Reach) x 100. While most online calculators stick to feed content, your native Instagram Insights has all the data you need to track this manually. Don't sleep on it—it’s a massive part of your community connection.
People always ask me if they should delete posts with low engagement. My answer is almost always a firm "no." Suddenly removing content can send weird signals to the algorithm and, more importantly, you erase valuable data. Instead of hitting delete, treat that post as a free lesson. Why didn't it work? Was the visual boring? Was the hook weak? If you're really committed to cleaning up your grid's aesthetic, archive it instead.
At the end of the day, tracking your metrics isn't about chasing a perfect score. It's about understanding the story your numbers are trying to tell you so you can write an even better one tomorrow.
Ready to stop guessing and start growing with a clear, data-driven strategy? Trendy analyzes your account to give you personalized content ideas, trending audio suggestions, and the best times to post. Join the beta and get your superpowered social media plan today!
