Tired of throwing content at the wall and just hoping something sticks? We’ve all been there. It feels like a guessing game, but the truth is, the top creators of 2026 aren't just getting lucky—they're using data.
This guide is your new playbook for mastering Instagram and TikTok analytics. We're going to turn those confusing numbers into a clear, actionable roadmap. You’ll finally understand why some posts take off while others flop, and more importantly, how to repeat your biggest wins over and over again.
It’s time to stop being a passive poster and start thinking like a savvy strategist. Let’s dive in and give your audience exactly what they want.
Think about it: launching a TikTok without checking your analytics is like sailing without a compass. You’re just drifting. With over 5.24 billion people scrolling through social media, you can't afford to get lost in the noise.
Here’s a little secret: creators who actually pay attention to metrics like reach, engagement, and watch time often see 30-50% faster growth than those who don't. That’s a massive advantage.
Of course, looking at data is one thing; understanding it is another. Before you get lost in the numbers, it helps to develop analytical skills that turn raw data into a real strategy for growth.
We’ll walk you through the built-in tools on Instagram and TikTok, but we’ll also introduce you to AI assistants like Trendy, your secret weapon for making sense of it all. Available on both iOS and Android, Trendy does the heavy lifting by analyzing your data and spitting out clear, actionable suggestions. Its AI-powered features give content creators a personalized weekly posting plan, complete with viral content ideas, optimal posting times, and trending sounds to help you stay ahead of the curve.
The bottom line is simple: Your data tells a story about your audience. Learning to read that story is the most powerful skill you can have. It’s what separates hoping for a viral hit from engineering one.
By the time you're done with this guide, you'll have a repeatable system for understanding what’s working, why it's working, and what to do next to blow up your accounts. For a deeper dive into the fundamentals, check out our complete guide on what is social media analytics.
Before you can start digging into the data, you’ve got to build your workshop. This is all about getting the foundation right—connecting your accounts and tools so they can start talking to each other. Think of it as setting up mission control before you launch the rocket.
First things first, and this is non-negotiable: you absolutely must switch to a professional account on both Instagram and TikTok. If you’re still rocking a personal profile, you’re flying blind. It's totally free to switch to an Instagram Business/Creator account or a TikTok Pro account, and doing so instantly unlocks a whole universe of data you can't see otherwise.
Making the switch is a breeze. It takes less than a minute on either platform, usually just a few taps in your account settings. Once you flip that switch, you’ll get access to the built-in analytics dashboards that show you the good stuff—who your audience is, how your posts are really doing, and where your follower growth is coming from.
This is your baseline. The native tools are great for a quick peek at performance, but they mostly tell you what has already happened. To really get ahead of the curve, you need to start understanding what’s likely to happen next. And for that, you need to bring in the big guns.
This is where you plug your profiles into a more powerful command center. While there are plenty of options out there, we’ll walk through connecting to Trendy, an AI-powered growth partner built specifically for creators. Its entire job is to take your native data and layer on predictive insights.
If you're curious about other platforms, we’ve broken down some of the best social media analytics tools in another guide.
Connecting your accounts to a tool like Trendy is secure and surprisingly simple. You'll just download the app for iOS or Android and follow the prompts to securely link your Instagram and TikTok profiles.

This simple connection is what lets the magic happen. It gives the AI permission to start its analysis of your content, your audience, and your unique corner of the internet.
Here's the real kicker: Linking your accounts isn't just about pulling in old data. The moment you connect, Trendy's AI starts analyzing your performance, niche, and audience engagement patterns to build a personalized growth plan. It’s already figuring out what’s working for you and spotting emerging trends you can jump on.
This whole setup shifts your strategy from being reactive to proactive. Instead of just looking back at last week's numbers, you now have an AI strategist in your pocket, feeding you content ideas and telling you what's poised to pop off.
It's the difference between reading a history book and having a crystal ball. With your accounts connected, you're officially ready to start translating all that data into killer content.
Alright, you've got your command center up and running, and the data is starting to flow in. It’s super tempting to just get hypnotized by a post that hits thousands of views, but let's be real—numbers without a story are just noise. To actually get good at this, you need to learn how to read between the lines of your data.
We’re going to move past the flashy, feel-good numbers and get into the KPIs that signal real, sustainable growth.
A classic rookie mistake is getting tangled up in Reach vs. Impressions. Here’s the deal: Impressions are just the total number of times your post was shown on a screen. If one person saw your Reel five times, that’s five impressions. Reach, on the other hand, is the number of unique people who saw it. That same person? They only count once for Reach.
While a big impression count can feel great, Reach is your true growth indicator. It tells you how many new eyeballs you’re actually getting in front of.
Likes just don't cut it anymore. By 2026, the algorithms on Instagram and TikTok have gotten way smarter, and they don't treat all interactions equally. If you want the platforms to push your content to new audiences, you have to understand this new hierarchy.
Here's the breakdown of what really matters:
Ever wonder why some Reels take off like a rocket while yours are stuck on the launchpad? The secret is usually buried in engagement analytics. We've seen that posts with hooks that have been tracked and optimized can pull in 73% more traffic for businesses. It's no joke.
On Instagram and TikTok, your engagement rate (that's likes + comments + shares, all divided by your reach) is everything. The top creators consistently hit a 3-5% engagement rate, while the average account is stuck around 1%. That difference is what gets you the algorithm's favor. For more stats on this, check out the latest from DataReportal.
For video-first platforms like TikTok and Instagram, view counts are just the tip of the iceberg. The real magic happens when you look at how long people are actually sticking around.
Two metrics are king here: Average Watch Time and Completion Rate.
Average Watch Time is exactly what it sounds like—the average length of time people watched your video. Completion Rate is the percentage of viewers who made it all the way to the end. These metrics are like a direct report card to the algorithm. High watch time tells the platform your content is captivating, which is precisely what it wants to promote.
Think about it: You post a 60-second video. Your Average Watch Time is 45 seconds. That’s a whopping 75% retention! The algorithm sees this and basically says, "Jackpot! People love this. Let's show it to everyone." This is how you land on the For You Page or the main Reels tab.
Once you start digging into these numbers, you’ll spot patterns you never saw before. Maybe you’ll notice that every video where you lead with a question has a way higher completion rate. Or that your tutorials that show the final result first get a ton more saves.
These aren't just random data points; they are a literal roadmap from your audience telling you what to create next. For a deeper dive on this, check out our guide on how to analyze content performance.
This is where a tool like Trendy becomes an absolute game-changer. Instead of drowning in spreadsheets trying to connect the dots yourself, Trendy’s dashboard lays out all these crucial KPIs in one clean, simple view. You can see what’s working at a glance.
Even better, its AI digs through your best-performing content and spits out trend suggestions and content formulas based on what your specific audience already loves.
Ready to stop guessing and start growing with intention? Grab the Trendy app on iOS or Android and start turning those analytics into your next viral hit.
Let’s be honest, data by itself is... boring. A spreadsheet full of metrics won't magically make your next TikTok go viral. But the story those numbers are telling? That's pure gold. This is the part where we stop being number-crunchers and start being content detectives.
It all boils down to a simple two-step dance: diagnose, then prescribe. You spot a problem or an opportunity in your data (the diagnosis), and then you cook up a specific, creative solution (the prescription). This simple shift takes the guesswork out of what to post next and replaces it with a deliberate, data-backed strategy.
Think of it this way: you notice a huge drop-off rate in the first three seconds of your videos. That's the diagnosis. The prescription? Time to test some killer new hooks. You could try starting with a controversial take, a visually jarring shot, or by asking a direct question. See? Every data point has a creative action waiting to happen.
This decision tree gives you a bird's-eye view of how to react to your content's performance.
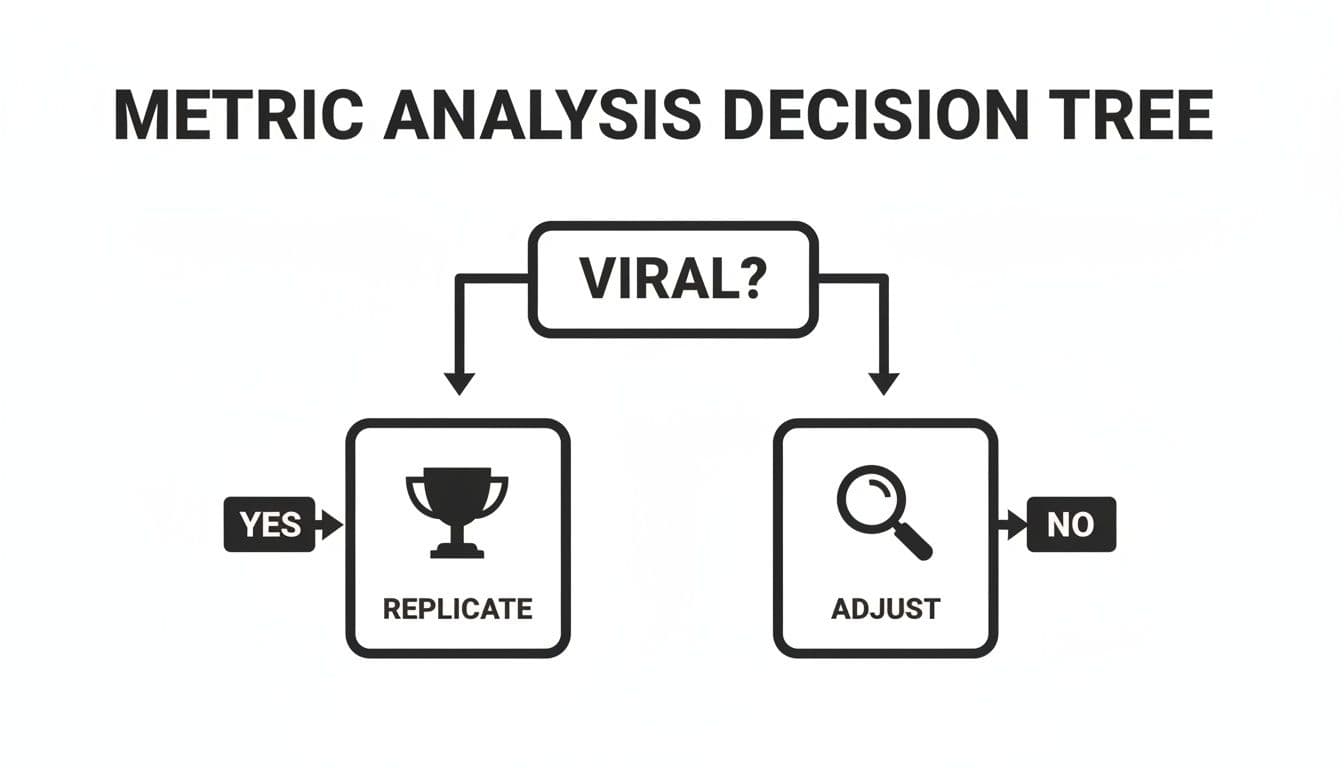
It really is that straightforward. If something works, figure out why and do more of it. If it bombs, use the data to figure out how to pivot.
So, your best-performing Reel last month was a snappy little tutorial showing off a "life hack." Diving into the analytics, you see it has a ridiculously high number of Saves. This isn't just some vanity metric—it's your audience screaming, "This is super useful! I'm keeping this for later!"
The diagnosis is crystal clear: Your audience is hungry for practical, valuable content.
Now for the prescription. You don't just make one more tutorial. You spin that single win into an entire content series.
Boom. You just turned one tiny data point into a month's worth of content you already know your audience wants. That’s how you build real momentum.
To help you get into this mindset, here's a quick guide for translating common data points into a concrete plan of attack.
| If You See This Data Point... | It Probably Means... | Your Action Plan Should Be... | How Trendy Helps |
| High Shares on a specific video format (e.g., a "how-to" Reel). | Your content is relatable and valuable. People want their friends to see it. | Create a series around this format. Brainstorm related "how-to" topics that solve similar problems for your audience. | Identifies your most-shared content formats and suggests follow-up ideas that tap into the same viral potential. |
| High Saves on a carousel post with tips. | This is "bookmarkable" content. Your audience finds it incredibly useful and wants to refer back to it. | Double down on educational carousels. Create checklists, step-by-step guides, or resource lists in this format. | Pinpoints your highest-saved posts and provides templates for similar, high-utility content. |
| Spike in Profile Visits after posting a TikTok about a niche topic. | You’ve hooked them! This topic made people curious enough to check out who you are. | Make this niche topic a recurring content pillar. Explore it from different angles in future videos. | Cross-references your performance data with niche trends, confirming if this topic is a hot spot. |
| Low Watch Time on videos longer than 60 seconds. | Your audience on this platform has a short attention span or your intros aren't strong enough. | Focus on sub-60-second content. For longer topics, test more aggressive hooks in the first 3 seconds. | Analyzes video completion rates and provides hook suggestions based on currently trending video styles. |
This table is your cheat sheet. It’s all about listening to what the data is whispering (or shouting) and responding with content that serves your audience better.
Let’s be real: manually sifting through data to find these golden nuggets can feel like a full-time job. By the time you spot a pattern and brainstorm an idea, the trend might already be over. This is exactly why AI-powered tools are becoming essential for any creator serious about growth in 2026.
This is where the Trendy app comes in.
Think of Trendy's AI as your personal content strategist. It automates that entire "diagnose and prescribe" process for you. The app digs through your performance metrics, figures out which content formats are crushing it, and cross-references all that with what's blowing up in your niche right now.
The result? A personalized weekly posting plan, sent right to you, packed with:
The real magic happens when you use the suggestions from the Trendy app on your iOS or Android device. You create an insanely powerful feedback loop: post AI-suggested content, let the app analyze its performance, and watch as it refines its next recommendations for even better results.
Imagine you're a food blogger. Trendy’s analysis flags that your 30-second recipe videos get 40% more shares than your longer vlogs.
The app doesn't just hand you that stat and walk away. It prescribes the fix. It might suggest three new quick-recipe ideas for the upcoming week, pair them with a trending audio clip popular among foodies, and tell you to post on Wednesday at 7 PM for max reach. You’re not guessing anymore—you’re executing.
Once you know what's working, you can explore a detailed guide to creating viral content with AI to push your ideas even further.
This is all about building a system. When you consistently translate what the numbers say into what you create, you stop chasing viral moments and start building a predictable engine for growth. To learn more, check out our guide on how to create viral content.
Let's be real: analytics can feel like a black hole. You could spend all day drowning in charts and graphs, but that's not the goal. The real win is creating a sustainable routine that delivers the goods—actionable insights—without leading to a full-blown data-induced burnout.
Consistency is the secret sauce. You preach it for your content, and you need to practice it for your analytics. You can't just dip into your stats whenever the mood strikes. To get real value, you need a rhythm, a predictable cadence that keeps you in the loop but not chained to your dashboard. This turns data from a chore into a powerful, manageable habit.
Think of this as your morning coffee with data. It’s quick, essential, and sets the tone for your day. All you need is five minutes each morning for a rapid-fire review. This isn't the time for deep, soul-searching strategy; it's about staying engaged and putting out any small fires before they grow.
Here's what your daily scan should cover:
This quick scan keeps you plugged into the immediate vibe of your audience and makes sure nothing important slips through the cracks.
Alright, now it's time to zoom out a bit. Carve out 30 minutes once a week—maybe every Friday morning with your favorite latte—to look for patterns. This weekly review is less about the nitty-gritty of one post and more about identifying the themes and trends that are actually moving the needle.
During your weekly huddle, focus on these questions:
This weekly rhythm is where you graduate from guessing what works to knowing what works.
That weekly review? It’s the perfect place to bring in a secret weapon like Trendy. Instead of you having to manually connect the dots, Trendy's AI does the heavy lifting, serving up a personalized weekly plan that slots right into this routine.
The app gets to know your account, figures out what’s resonating, and then delivers a platter of content ideas, trending sounds, and the best times to post. It basically automates the whole "diagnose and prescribe" part of the process, turning your 30-minute review into a focused, high-impact planning session. With Trendy, available for both iOS and Android, you’re not staring at a blank slate; you’re starting with a data-backed game plan.
Once a month, block out about an hour on your calendar. This is your "state of the union"—a high-level strategic review to assess your overall growth and make sure your daily efforts are actually pushing you toward your bigger goals.
Your monthly report should answer the big-picture questions:
Key Takeaway: This simple rhythm—daily, weekly, and monthly—is your best defense against data overload. It ensures you’re grabbing immediate opportunities, spotting weekly trends, and steering your long-term strategy with confidence.
Getting your timing right isn't just luck—it's analytics. The data shows that posting when your audience is most active can boost engagement by 20-30%. That's a huge edge, especially with the number of social media users projected to hit 5.44 billion by 2026. You can find this info right in your native tools. TikTok shows you follower territories and time zones, while Instagram Insights pinpoints the exact hours and days your audience is scrolling. For a broader look at the global social scene, you can discover more insights about user statistics on Statista.com.
By sticking to this simple, repeatable cadence, you’ll turn analytics from a daunting task into your most powerful engine for growth. And if you need a hand organizing it all, check out our guide on building a killer social media reporting template.
Alright, so you’ve got your command center set up, you're starting to speak the language of metrics, and you’re turning those numbers into an actual content plan. Awesome. But as you dig deeper, you'll inevitably hit some new, trickier questions. It happens to everyone.
Let's tackle some of the most common head-scratchers I hear from creators. Think of this as your personal analytics help desk—no jargon, just straight-up answers to help you navigate your data with confidence.
This is the big one, isn't it? You're putting in the work, but when does the magic happen?
While you can get some quick wins right away—like realizing you've been posting when your entire audience is asleep—seeing real, sustained growth from your data-driven changes typically takes about 4-6 weeks.
You have to treat it like a science experiment. You look at your data and form a hypothesis ("My audience seems to love 'how-to' Reels"). Then, you test that hypothesis by consistently posting that type of content for a few weeks. Finally, you circle back to the data to see what happened. It’s a constant cycle of trying, watching, and tweaking.
Patience is key, but you can definitely speed things up. An AI-powered tool like Trendy can give you a massive head start. Instead of waiting weeks to spot a pattern yourself, its AI is already analyzing your niche to give you smart ideas from day one. Just remember, analytics is a marathon, not a sprint toward one viral hit.
Everyone gets hung up on likes and views. But the real pros know where the gold is hidden. The two most powerful (and criminally overlooked) metrics are Saves on Instagram and Shares on TikTok.
Here’s why they’re a big deal:
Anytime you see a post with an unusually high number of saves or shares, drop everything and dissect it. What format was it? What hook did you use? What problem did you solve for the viewer? That post is a roadmap to your next big hit.
The short answer is no, you can't sneak a peek at another account's private dashboard. Their exact reach, audience demographics, and watch time stats are for their eyes only. But that doesn't mean you have to fly blind.
You can still do some incredibly effective sleuthing by tracking their public metrics. Go look at their engagement rates (likes + comments divided by followers), see which content formats they’re leaning into, and analyze the hashtags that are getting them traction. This paints a pretty clear picture of their public strategy.
This is another area where a tool like Trendy becomes your secret weapon. The app's AI doesn't just look at your profile; it constantly scans emerging trends and top-performing content across your entire niche. In a way, it does the competitive research for you by showing you the sounds, formats, and topics that are already working for others in your space.
Pro Tip: The goal isn't to copy your competitors—it's to learn from them. If you see a video format crushing it for them, ask yourself, "How can I put my own unique spin on this to make it even better for my audience?"
This is a false choice. You absolutely have to do both. Data should be the guardrails for your creativity, not a cage. The most successful creators in 2026 will be the ones who understand that analytics and creativity are two sides of the same coin.
Here’s a better way to think about it:
Let's say your data shows that "day-in-the-life" vlogs get you tons of engagement. Great. That's your data-driven starting point. But how you shoot, edit, and talk about your day—the stories you tell, the jokes you make, the visual style—that's where your creativity shines and makes people follow you instead of someone else. Let the data point you to the right stage, then let your creativity put on the show.
Ready to stop guessing and start growing? The Trendy app is like having a personal AI content strategist in your pocket, taking the guesswork out of social media. Get personalized trend suggestions and a weekly posting plan that turns your data into content that actually works.
Download Trendy today on the App Store or Google Play and start your journey to smarter growth.
