Social Media Analytics and Reporting: A Creator's Guide
Master social media analytics and reporting with this practical guide. Learn key metrics, dashboard best practices, and how to turn data into growth
Social media analytics and reporting is not about collecting more numbers. It's about building a repeatable cycle where every post teaches you something specific about your audience, and the USD 4.8 billion social media analytics market in 2023, projected to exceed USD 14.6 billion by 2028, shows how central that work has become.
You check Instagram before breakfast, glance at TikTok after lunch, and still can't answer the question your next post depends on: what should I repeat, change, or stop doing? A rising graph feels reassuring until reach falls, comments become shallow, and your content calendar starts filling with guesses.
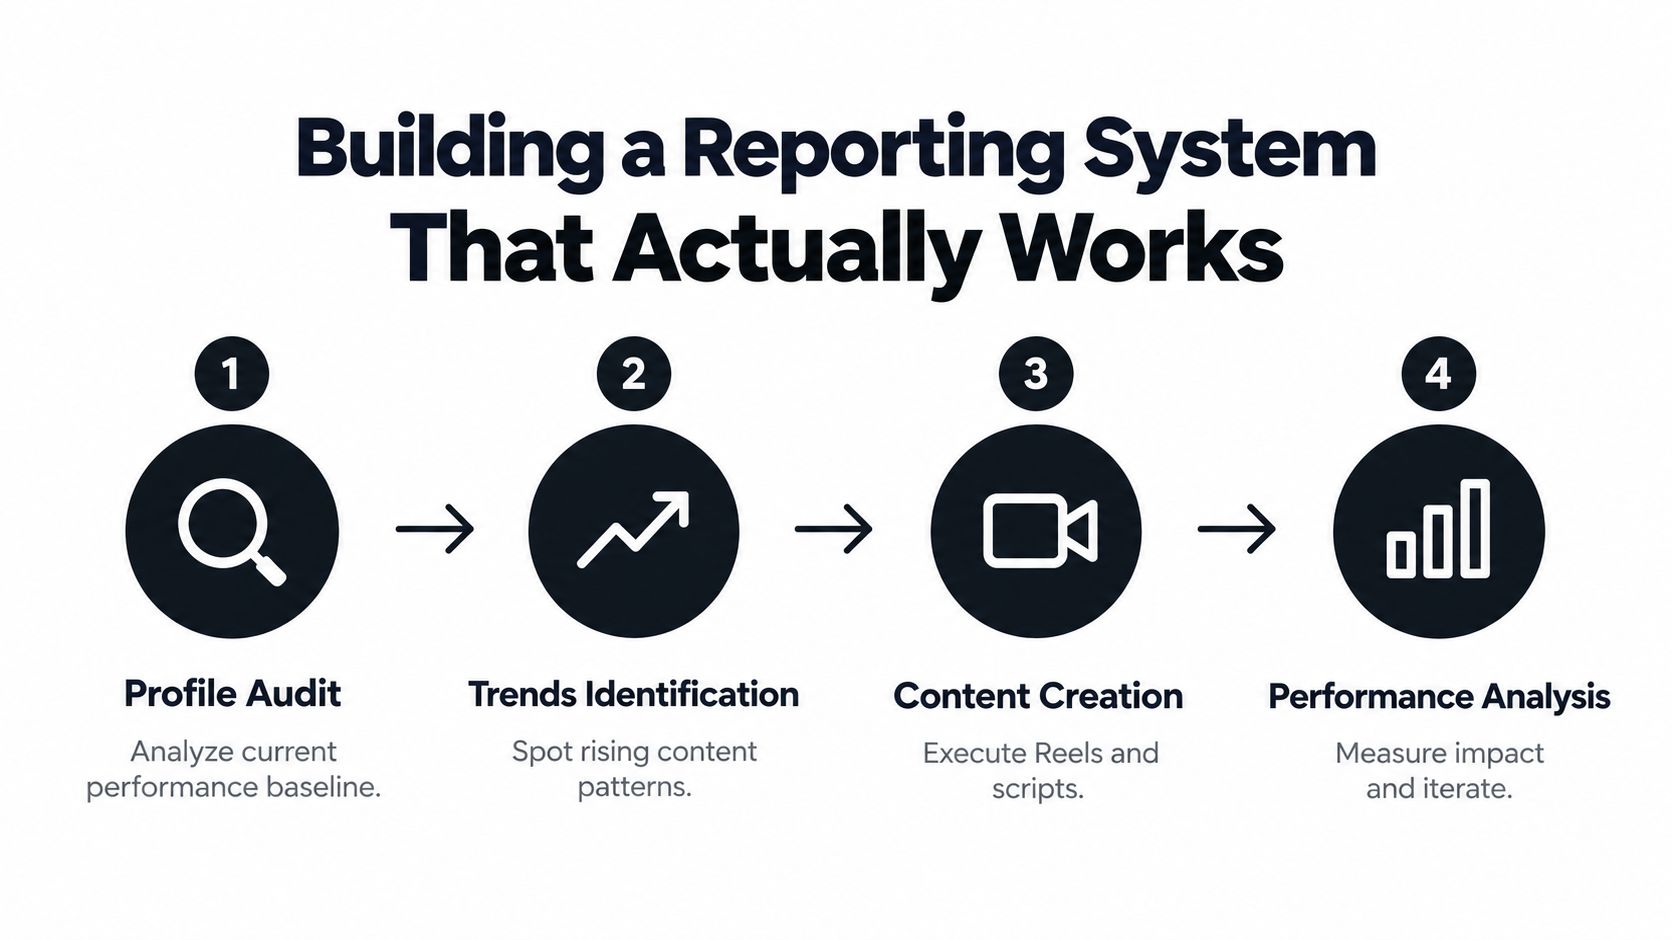
The practical answer is a connected workflow. Audit the profile, identify relevant trends, create for the format and platform, then analyze performance against a clear baseline. Reporting becomes useful when it changes the next creative decision, not when it produces another attractive dashboard.
The Hidden Truth Behind Social Media Metrics
A creator can spend an hour exporting reach, impressions, likes, shares, profile visits, follower changes, and watch-time data, then finish with no idea what to publish tomorrow. The dashboard looks busy, but the decision is still missing. That's the hidden failure in social media analytics and reporting: data collection feels like progress even when it produces no creative action.
The usual pattern is easy to recognize. A Reel gets unusually broad distribution, so the creator labels it a success and copies its topic. The next version uses a weaker opening, takes longer to reach the point, and attracts passive views rather than saves or shares. The report records another result, but nobody records the creative variable that changed.
Replace the scoreboard with a learning loop
A useful report answers three practical questions:
What happened? Record reach, impressions, interactions, audience growth, and any relevant conversion action.
Why might it have happened? Compare the hook, format, topic, length, visual treatment, and audience response with previous posts.
What changes next? Turn the observation into one test, such as a sharper opening, a shorter edit, or a more specific call to action.
Raw interaction totals can also mislead when traffic and attribution don't line up. A click recorded by an advertising platform may not appear as an equivalent session in an analytics tool, so this explanation of the discrepancy between Meta Ads link clicks and Google Analytics sessions is useful when a report appears internally inconsistent.
A simple content log can prevent most of this confusion. Add the post URL, platform, format, topic, hook, publication date, intended action, and result. Then write one sentence explaining the result. “The practical checklist earned more saves than entertainment posts” is far more useful than “engagement was good.”
Practical rule: Never save a metric without saving the creative decision it is supposed to inform.
The market's movement from niche software toward core marketing infrastructure reinforces this shift. One estimate places the global market at USD 4.8 billion in 2023, with growth to more than USD 14.6 billion by 2028, a projected 24.9% CAGR across that period, according to Mordor Intelligence's social media analytics market overview. The opportunity isn't owning more reports. It's using measurement to make better content decisions repeatedly.
For a practical explanation of how exposure differs from deeper performance, see this guide to social media impressions. It helps separate distribution from audience response, which is the first step toward a reporting system that teaches rather than decorates.
Core Metrics Every Creator Should Track
The right metric depends on the job a post needs to do. A Reel designed for discovery needs a different reading than a Story designed to prompt replies, and a carousel built to generate saves shouldn't be judged by the same headline number as a live session.
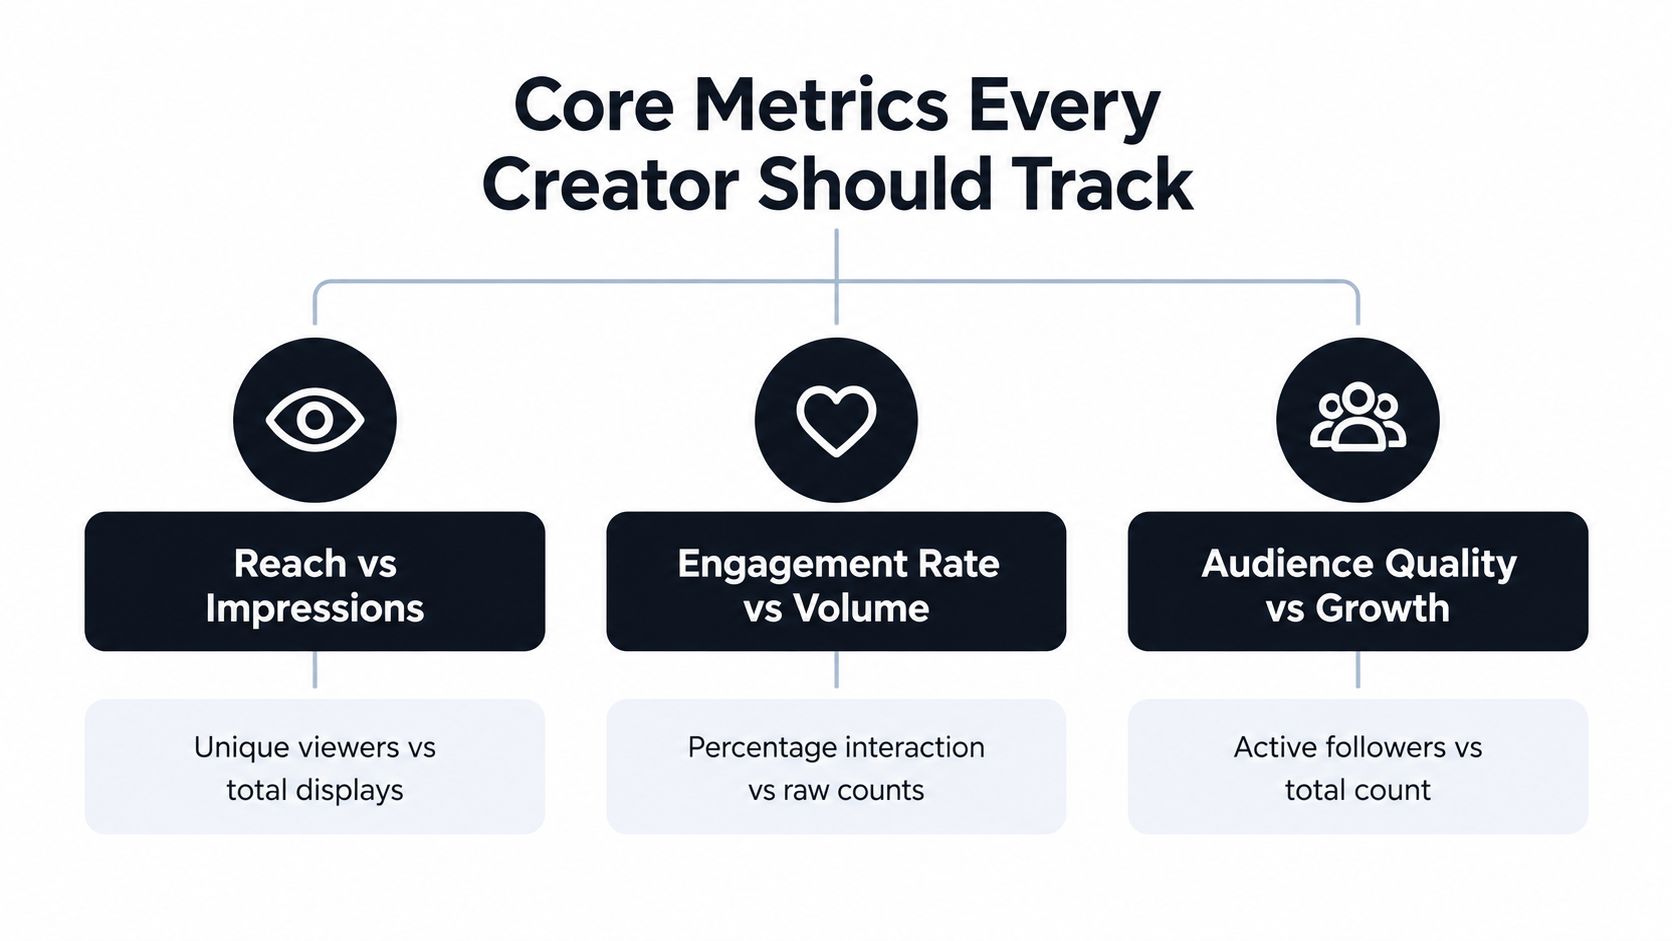
Start with four layers. Reach metrics tell you how far content traveled. Audience metrics show who is watching and whether the account is attracting relevant people. Activity metrics reveal the effort viewers are willing to make. Conversion metrics connect attention to a measurable next step.
Read distribution before reaction
Reach is the number of unique accounts exposed to content, while impressions count total displays. A post can have strong impressions because the same people saw it repeatedly without reaching many new viewers. Track both, then ask whether the post was intended to deepen awareness with existing followers or introduce the account to new people.
Follower growth belongs beside audience quality, not above it. A larger audience isn't automatically more valuable if new followers don't watch, respond, save, visit the profile, or take the action the account needs. Review demographic fit, recurring viewers, and the source of growth where the platform makes those signals available.
Normalize interaction so comparisons stay fair
Likes and comments are raw activity. Engagement volume becomes more useful when normalized against the follower base or another defined audience denominator. Research distinguishes overall engagement from engagement volume because follower-normalized measurement supports fairer comparisons between large and small accounts and across different periods, as explained in this research on social media engagement measurement.
Use the formula consistently within your own reporting. Don't compare a rate calculated against followers with another rate calculated against reach and treat the difference as a content insight. The denominator changes the story.
Match the KPI to the format
Reels: Review reach, average watch behavior, completion, shares, saves, profile visits, and follows. A high view count with weak retention may signal a strong topic and a weak edit.
Carousels: Prioritize saves, shares, comments that show consideration, and profile actions. A carousel can be valuable even when it doesn't produce explosive reach.
Stories: Examine completion, exits, replies, sticker interactions, and link actions. Story performance often depends on sequence quality rather than one frame.
Live sessions: Track viewer patterns, comments, returning viewers, follows, and meaningful actions during the broadcast. A short spike isn't the same as sustained attention.
Conversion posts: Follow link clicks, landing-page visits, sign-ups, enquiries, or purchases with consistent tracking. Engagement is supporting evidence, not the final outcome.
For a more detailed KPI selection framework, use this guide to KPIs for social media. The discipline is simple: choose the metric that reflects the post's intended job, then resist celebrating a different number because it looks larger.
Building a Reporting System That Actually Works
A reporting system should let you move from observation to decision without opening five disconnected dashboards. The cleanest setup combines three levels of information: the account as a whole, individual posts, and the people responding to them.
Page-level data shows account health, audience development, reach direction, and channel mix. Post-level data identifies winning topics, formats, hooks, and creative treatments. Member-level or audience-level data reveals who responds, how they behave, and whether the people engaging resemble the audience you want.
Use one weekly view and one monthly view
Your weekly report should be operational. Keep it compact and answer:
Which posts earned the strongest qualified response?
Which posts underperformed against the account's recent baseline?
What should change in the next publishing cycle?
Your monthly report should interpret patterns. Compare reach, impressions, engagement rate, follower growth, and conversion outcomes against a consistent historical period or a carefully chosen peer reference. The point isn't to rank every post. It's to isolate whether the result came from content quality, audience scale, timing, or an external event.
Research on social performance measurement supports combining page-level, post-level, and member-level metrics, then comparing reach, impressions, engagement, follower growth, and conversion outcomes rather than relying on one layer alone. This framework for measuring social media performance is especially useful when a large account's scale makes raw totals look stronger than the underlying response.
Build the dashboard around decisions
Create four panels rather than one crowded wall of charts:
Account health: Reach direction, impressions, audience growth, and profile activity.
Content winners: Top posts grouped by format, topic, hook, and intended action.
Content warnings: Posts with weak retention, low-quality comments, unusual exits, or poor conversion behavior.
Next tests: A short list of creative hypotheses with a status, owner, and planned format.
Use the same metric definitions every time. If your engagement rate changes formula from one report to the next, the trend line becomes a measurement artifact. If platform figures disagree, document the definitions and attribution windows rather than forcing them into false precision.
A reusable report template for 2025 insights can help with the reporting layout, but don't let a template dictate your decisions. The report should finish with actions such as “test the same topic with a stronger first frame” or “turn the saved carousel into a short video,” not with a list of disconnected totals.
For a dashboard structure built around ongoing decisions, see this guide to a social media dashboard. A good dashboard reduces the time spent hunting for numbers and increases the time spent interpreting them.
Platform-Specific Analytics and Reporting Approaches
Instagram, TikTok, LinkedIn, Threads, and X don't reward identical behavior, so a universal dashboard creates misleading comparisons. Use the same strategic questions across platforms, but change the signals you emphasize.
Professional content often succeeds through discussion and qualified interest
Threads and X
Replies, reposts, profile visits, link actions, conversation quality
Distribution matters, but the quality and continuation of conversation matter more
Instagram rewards the opening and the edit
Instagram's Help Center states that Reels can be recorded and edited in the app for up to 3 minutes, while Reels have a hard minimum of 3 seconds. Templates also require music and at least 3 clips, so a template workflow won't apply to every video, as outlined in Instagram's Reels feature information.
For discovery-focused videos, a neutral industry guide advises making the first 3 seconds count and notes that Reels under 90 seconds tend to perform best for reaching new audiences, according to this Instagram Reels guide. Treat those figures as workflow constraints to test, not guarantees. Report the opening retention and completion behavior to learn whether the rule fits your audience.
TikTok needs a different reading rhythm
TikTok reporting should connect the first frame, editing pace, sound choice, caption language, hashtags, and viewer retention. Use trend discovery to find relevant formats, not to attach an unrelated popular hashtag to a weak idea. An editing workflow might move from a ready-to-shoot script, to a rough phone recording, to captions and cuts in an editing app, then to a post-level review.
TikTok LIVE has an eligibility gate before performance analysis begins. TikTok says creators must be at least 18 years old and must meet a local minimum-follower threshold to access LIVE, according to its official LIVE eligibility guidance. Once access exists, review viewer continuity and conversion into followers or conversations, rather than chasing a single peak.
For a practical walkthrough on how to turn TikTok data into viral growth, focus on translating analytics into concrete changes to hooks, edits, and topics. Instagram-specific reporting guidance is also available in this article on Instagram analytics.
The Trendy Workflow for Repeatable Analytics
The most useful social media co-pilot workflow starts before publishing and continues after the post has finished circulating. Profile Audit → Trends and Ideas → Content Creation → Performance Analysis gives every metric a place in the process.
Begin with the Profile Audit. Review the account's positioning, recent formats, audience response, posting consistency, and visible gaps. The audit should produce a baseline, not a verdict. You want to know which topics already attract attention, which formats create meaningful actions, and which parts of the profile make a new visitor hesitate.
Turn signals into a production brief
The Trends and Ideas stage filters emerging sounds, hashtags, formats, and topic angles through the account's niche. A trend is only useful when it can carry your message. Save several ideas, then classify each by platform and format:
Instagram: Reels, carousels, Stories, and visual post concepts.
TikTok: Ready-to-shoot scripts, hooks, scene structures, and live prompts.
LinkedIn: Opinion posts, educational carousels, and professional case explanations without invented results.
Threads and X: Short observations, replies, conversation starters, and text-led sequences.
The Content Creation stage turns the selected idea into an executable brief. Write the hook first, define the scene structure, decide where captions appear, and state the intended action. For an Instagram Story sequence, plan the frames and reply prompt. For a TikTok, specify the opening line, visual change, proof or explanation, and closing prompt.
Keep scheduling practical. Batch related posts, schedule Instagram Stories and feed posts where your publishing setup supports it, and leave room to respond to conversations. Scheduling should protect consistency, not force irrelevant content into a calendar.
The final stage is Performance Analysis. Compare each post with the baseline and log one explanation plus one next test. The process can be supported through Trendy's web app, with its iOS app on the App Store and Android app on Google Play. It analyzes profile and content performance, surfaces ideas and hooks, and connects planning with post-level review.
Beyond Engagement Rate Measuring What Actually Matters
Engagement rate is useful, but it isn't a universal definition of success. A post can attract many low-effort reactions and still fail to build trust, retention, qualified interest, or action. Another post can generate modest public activity while producing saves, private shares, thoughtful replies, or profile visits that matter more to the account's objective.
Use engagement as a diagnostic layer. For discovery content, reach and impressions help establish distribution. For educational content, saves and shares may reveal utility. For community content, thoughtful comments and reply depth can matter more than the total number of reactions. For a sales-oriented post, clicks, enquiries, sign-ups, or purchases deserve the final word.
Weight the signals by audience effort
A practical hierarchy looks like this:
Passive signals: Likes and brief reactions show recognition, but they rarely explain why someone valued the content.
Active signals: Saves, shares, reposts, and substantial comments require more effort and often reveal stronger relevance.
Retention signals: Completion, repeat viewing, and continued live participation show whether the content held attention.
Intent signals: Profile visits, direct messages, link actions, registrations, and enquiries connect interest to a next step.
Brand signals: Sentiment, recurring mentions, branded search behavior, and audience language help identify broader influence.
Recent marketing measurement guidance describes a move toward watch time, saves, shares, completion, sentiment, and branded search, while also noting that visual listening can catch brand mentions in images and videos that text-only monitoring misses. The same discussion highlights a platform-specific reality: engagement remains a leading success measure on Instagram and TikTok, while impressions can matter more on other channels, as explained in current marketing metric trends.
Report the uncomfortable result
A report earns trust when it includes signals that challenge the preferred story. If reach rises but completion falls, the opening may attract attention without delivering value. If engagement rises while profile visits stay flat, the content may entertain without positioning the account. If clicks rise but qualified enquiries don't, the promise and landing experience may not match.
More engagement isn't automatically better. Better means the audience takes the action your content was designed to encourage.
Dark social and attribution gaps make this even more important. Private shares, messages, screenshots, and word-of-mouth influence can escape conventional tracking, so treat reported conversions as evidence with limitations rather than a perfect account of influence. Pair quantitative results with a small qualitative review of comments, replies, and audience language.
Your Analytics and Reporting Endgame
A sustainable system doesn't require you to stare at every metric every day. It requires a dependable rhythm that catches problems early, identifies patterns at a useful interval, and sends the conclusion back into content planning.
Start with three dashboard views:
The account view shows overall reach, impressions, audience development, profile activity, and channel health.
The content view ranks posts by their intended job, then groups results by topic, format, hook, and creative treatment.
The decision view records the insight, the evidence, the next test, and the date you'll review the result.
Set a reporting rhythm you can maintain
Use a short weekly review for operational decisions. Check recent posts, unusual changes, weak retention, audience responses, and the next publishing queue. Don't rewrite your entire strategy because of one noisy result. Record the observation and look for a pattern across related content.
Use a monthly review for strategic choices. Ask which formats are earning useful attention, which topics attract the right audience, whether growth quality is improving, and whether social actions connect with the business outcome you care about. Keep the same definitions and comparison periods so the report builds institutional memory.
A quarterly review can examine broader channel roles, recurring themes, content production costs, and the balance between discovery, community, and conversion. It should end with resource decisions, not a larger spreadsheet.
Close the loop after every post
The complete cycle is straightforward:
Profile Audit: Establish the account baseline and identify gaps.
Trends and Ideas: Select relevant topics, sounds, hashtags, formats, and angles.
Content Creation: Produce the right asset, from Reels and TikToks to carousels, visual concepts, LinkedIn posts, and Threads or X updates.
Performance Analysis: Measure the intended outcome, explain the result, and create the next test.
This approach also prevents a common planning mistake. Creators often build a calendar first and analyze later, which turns reporting into a post-mortem. A stronger process lets the audit shape the ideas, lets the ideas shape the creative brief, and lets the performance review refine the next calendar.
Tomorrow, open the account baseline, choose one relevant trend, write one clear hook, and define the metric that will decide whether the test worked. Then publish, review the result after enough time has passed for a fair comparison, and record the lesson in plain language. You don't need perfect attribution to improve. You need consistent definitions, honest interpretation, and the discipline to let evidence change what you make.
Trendy combines profile audits, trend and idea discovery, ready-to-shoot scripts, hooks, content planning, and performance analysis for Instagram and TikTok creators, small businesses, and social media teams. Visit Trendy to connect your workflow, turn social data into practical next-post decisions, and build a reporting habit that improves with every piece of content.