Maya has five tabs open: Instagram Insights, TikTok Analytics, a notes app, a spreadsheet, and her content calendar. She can see plenty of numbers, but she still can't answer the useful questions: which videos deserve another version, what should she post next, and whether all that attention is moving people toward her business.
A social media dashboard brings those answers into one working view. It combines connected account data, compares meaningful performance signals, and turns them into decisions about content, timing, workflow, and budget. The right dashboard isn't a wall of attractive charts. It's a decision system that helps you track what happened, understand why it happened, and choose your next move.
What a Social Media Dashboard Actually Does
A social media dashboard collects information from platforms such as Instagram, TikTok, Facebook, LinkedIn, YouTube, and X, then presents it in a consistent format. Instead of opening each native analytics tool separately, you can review reach, engagement, audience activity, clicks, and content results in one place.
That central view matters because each platform labels and emphasizes performance differently. A Reel, TikTok, carousel, and LinkedIn post don't behave alike, so a useful dashboard shouldn't flatten them into one meaningless score. It should help you compare signals while preserving the context of each format.
Practical rule: A dashboard earns its place when every important metric leads to an action.
For Maya, that might mean noticing that practical “three ways to style” videos generate more saves than personal updates. Her next decision isn't just “celebrate the high-performing post.” It's to create another useful variation, test a different opening, and schedule it when her audience is active.
A dashboard can support four recurring questions:
- What should I post next? Use content performance, saves, shares, comments, and watch behavior to identify repeatable themes.
- Where should I focus? Compare channels by their role, such as awareness, engagement, traffic, or conversion assistance.
- When should I publish? Combine platform benchmarks with your own audience activity instead of relying on one universal time.
- What needs attention? Catch unusual drops, rising interactions, broken links, or fast-moving posts while action is still possible.
For a practical introduction to measurement, see how to track social media analytics. If you're researching public activity or building a wider monitoring process, Scrapeway's social media scraper benchmark can also help you understand how social data collection differs by source.
By the end of a good dashboard review, you should have more than a report. You should know what to repeat, what to change, what to stop, and what to test next.
The Core Building Blocks of Every Dashboard
Think of a social media dashboard as a well-organized kitchen. Ingredients arrive from different suppliers, the shelves keep them accessible, the counters make preparation easier, and the final meal gives someone a reason to act. A dashboard works the same way, moving from raw platform data to a useful decision.
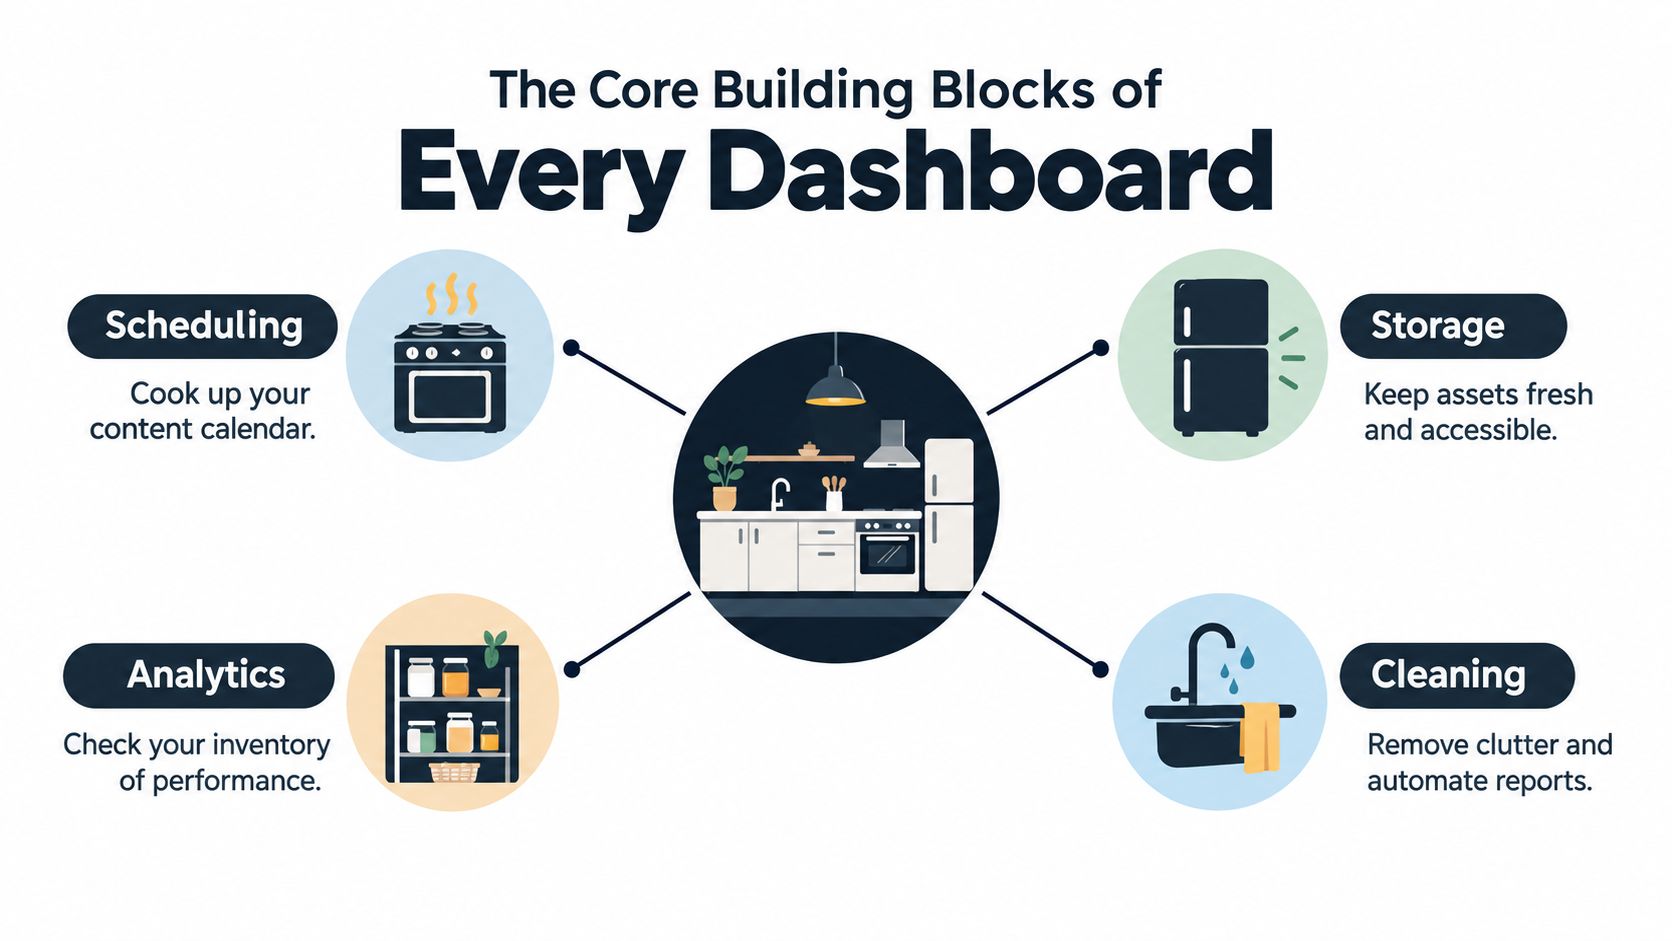
Data sources are the ingredients
The first layer contains connected accounts. Instagram, TikTok, YouTube, LinkedIn, X, and Facebook each provide different fields, permissions, and reporting windows. A dashboard can only work with the data a platform makes available, so account connections and permissions are part of the product's practical foundation.
The metrics layer makes comparisons possible
Raw numbers need definitions. Reach means people who saw content, while impressions describe exposures. Saves, shares, comments, clicks, and conversions represent different types of intent. The metrics layer standardizes those signals enough for comparison without pretending that a TikTok view and an Instagram Reel view mean exactly the same thing.
A rate-based view is often more useful than a total. A post with 100 likes from 500 followers has stronger like efficiency than one with 150 likes from 1,000 followers. That's why a dashboard should normalize performance using engagement rate, reach, and meaningful interactions rather than optimizing for raw likes alone, as explained in Later's analysis of posting times and engagement.
The view layer gives numbers a shape
Overview cards help you scan account health. Per-post breakdowns show which creative choices worked. Audience views reveal who responds, while date filters let you compare a launch period with a normal publishing period. Without the right view, good data stays buried.
The action layer turns insight into work
The final layer recommends or triggers a next step. It might suggest a posting window, surface a content theme, flag a falling format, or remind you to review a sudden rise in saves. The flow is simple: an account sends data, the dashboard organizes it, and the resulting view changes what you do.
This Instagram analytics guide is useful when you want to connect those layers to a specific platform rather than treating every network as identical.
Essential Features for Creators and Brands
A feature matters when it removes a task from your day. Start with account connections. If you manage a personal Instagram profile, a TikTok account, and a client page, switching logins creates friction and makes context easy to lose. A unified workspace should let you see the right accounts without rebuilding the same report in several native tools.
Scheduling comes next. A calendar view lets you see whether your week has a healthy mix of Reels, TikToks, carousels, visual posts, LinkedIn updates, and Threads or X posts. For a creator who batches TikTok videos on Sunday, the useful workflow is to upload clips, attach captions and hashtags, assign publishing windows, and review the queue before anything goes live.
Instagram's native workflow has an important distinction. Feed posts and Reels can be scheduled in the Instagram app, while Story scheduling is handled through Meta Business Suite rather than the Instagram app itself, as outlined in this guide to scheduling Instagram posts. A dashboard should make that difference visible instead of promising one identical publishing flow everywhere.
Build beside your analytics
Drafting and asset storage keep creative work close to performance data. Store a Reel concept beside its hook, scene structure, caption, hashtags, and source clip. For a carousel, keep the slide outline and visual post concept together. That setup makes it easier to turn a winning topic into a series without hunting through folders.
A strong creator workflow should support:
- Ready-to-shoot scripts: Move from an idea to a hook, scene sequence, spoken lines, and filming notes.
- Cross-format adaptation: Rework one insight into an Instagram Reel, TikTok script, carousel, LinkedIn post, or Threads/X post.
- Review and approval: Let a small team check copy, visuals, links, and brand fit before publishing.
- Reporting exports: Create a weekly snapshot that a client or stakeholder can understand without a slide deck rebuild.
- Alerts: Surface a sudden reach decline, unusual save activity, comment spike, or publishing failure.
Competitor benchmarking can add context, but it shouldn't replace account-level evidence. Platform APIs restrict access, privacy changes limit collection, and freshness can lag, sometimes by 24 to 48 hours, according to Improvado's overview of social media dashboards. The most accurate dashboard depends on whether you need native-source truth, cross-channel comparison, or executive reporting.
Timing also needs testing rather than blind automation. Cross-platform benchmarks show Facebook often performs well on weekday mornings, Instagram commonly peaks from midday into evening, LinkedIn tends to work in midmorning to early afternoon, and X can vary between morning and evening windows. A recommendation engine should combine those benchmarks with account history, audience-active-hour data, and platform-specific results, then test 2 to 3 candidate slots for at least two weeks before updating its predictions, as described in Buffer's cross-platform timing analysis.
KPIs That Matter Beyond Vanity Metrics
Likes are easy to notice because they're visible and familiar. They're not always the clearest sign that a post helped you reach a goal. A dashboard becomes useful when it separates attention from intent and shows which signals deserve a response.
Reach tells you how many people saw the content. Impressions show exposure volume. Engagement rate puts interactions in context, making it more useful than a raw like total when accounts have different audience sizes.
Saves often indicate practical value. A person saves a tutorial, checklist, recipe, or product reference because they may want to return to it. Shares suggest that the content was useful or entertaining enough to pass to someone else. Comments reveal conversation, objections, questions, and language your audience may use in future content.
Watch behavior adds another layer for video. Watch time and retention help you identify whether the opening earns attention and whether the middle of the video keeps it. A video with 50K views and a 1% save rate may be entertaining but not especially useful, while a smaller post with a 3% save rate may contain a stronger utility signal. Those figures are examples for interpreting a dashboard, not general performance benchmarks.
A view tells you that someone arrived. A save, share, click, or thoughtful comment tells you more about why they stayed.
Match each KPI to a decision
| Metric | What It Measures | Decision It Informs |
| Engagement rate | Interaction relative to the selected audience or reach base | Whether the creative connects efficiently |
| Reach | Unique exposure | Whether distribution is expanding |
| Saves | Return or reference intent | Which educational topics deserve another version |
| Shares | Pass-along value | Which ideas can support broader discovery |
| Watch time | Depth of video attention | Whether the hook and structure hold interest |
| Click-through rate | Movement from content to a destination | Whether the message and call to action work |
| Profile visits | Curiosity after exposure | Whether the post creates interest in the account |
| Conversion signals | Actions such as sign-ups, downloads, or purchases | Whether social activity supports business outcomes |
Brands should add link clicks, UTM-tracked conversions, follower growth quality, and cost-per-result when those measures are available. A dashboard won't solve attribution by itself. Platform fragmentation, weak integrations, and privacy restrictions can make it difficult to connect social activity to revenue. Improvado's social media reporting coverage highlights that proving campaign effectiveness remains difficult even when teams track engagement and conversions.
Use these social media KPI principles to choose a small working set. Every KPI should answer a question such as what should I post next, when should I publish, which channel should receive more effort, or what conversion path needs fixing.
How to Evaluate and Choose a Dashboard
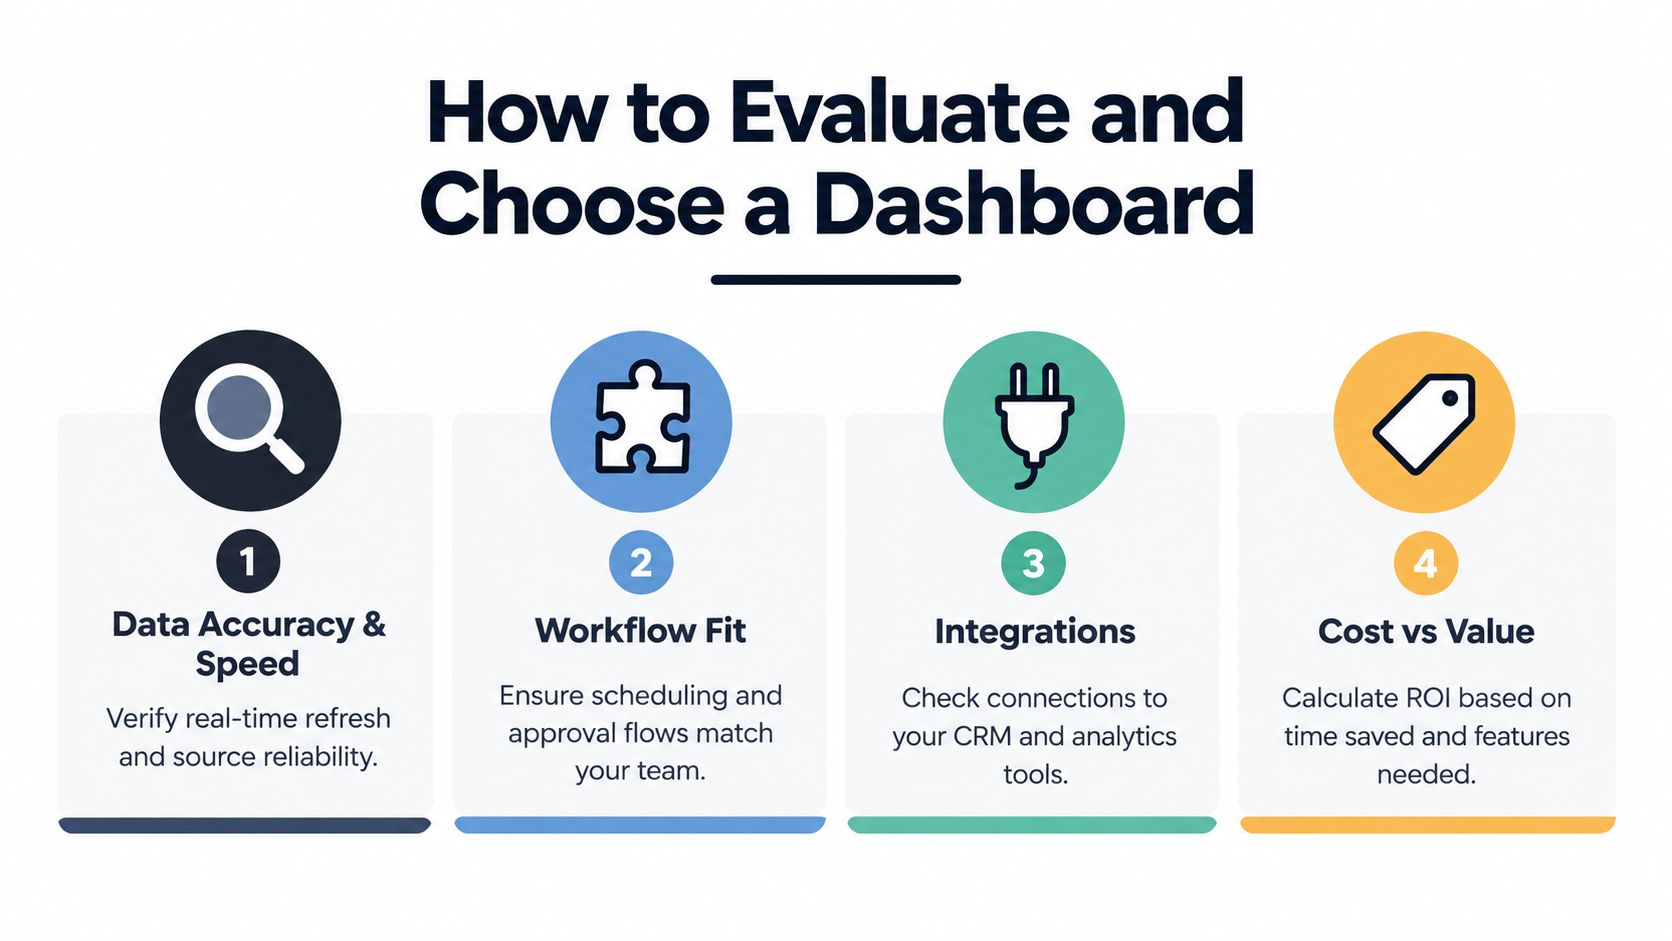
The cheapest tool isn't automatically the most economical choice. A dashboard that saves reporting time but can't support your publishing workflow may create new manual work elsewhere. Evaluate candidates with four filters.
Check data accuracy and speed
Confirm which platforms connect directly, which metrics are available, and how often data refreshes. Ask whether the tool distinguishes native metrics from estimates. If a viral Reel needs a quick response, delayed data may be less useful than a smaller dashboard with clearer freshness rules.
Test the workflow fit
Create a draft, schedule a post, attach an asset, assign an approver, and export a report. Do those tasks feel natural on desktop and mobile? Check whether the tool supports your real formats, including Reels, TikToks, Stories, carousels, LinkedIn posts, and Threads or X updates.
Read the commercial limits
Look beyond the headline price. Check connected-account limits, user seats, reporting restrictions, export options, storage, and advanced feature access. A solo creator and a two-person agency may need very different plans even if they manage a similar number of channels.
Separate analytics from assistance
Traditional analytics tools describe past performance. An AI co-pilot can add suggestions, draft hooks, surface trends, flag declining formats, and help turn an insight into a ready-to-shoot script. That difference matters if your main problem isn't seeing the data, but deciding what to create next.
Score each candidate against your actual week, not its feature page. This guide to social media analytics for business can help you think through reporting needs before comparing tools.
Choose the dashboard that fits your decisions, not the dashboard with the longest feature list.
Real Use Cases From Solo Creators to Small Brands
A solo creator named Elena publishes on TikTok and Instagram. Her dashboard shows that broad lifestyle clips receive views, while concise tutorials earn more saves and replays. She doesn't need to abandon lifestyle content. She can use it for discovery, then build a repeatable tutorial series that gives interested viewers a reason to return.
Her next move follows a simple loop:
- Review the strongest topics and formats.
- Turn one theme into several hooks.
- Create a ready-to-shoot script and matching visual concept.
- Schedule platform-specific versions.
- Compare saves, shares, watch behavior, and profile visits after publishing.
A small direct-to-consumer brand may read the same dashboard differently. Instagram could assist conversions through profile visits and link clicks, while TikTok introduces the product to people who aren't familiar with it yet. UTM-tagged links and conversion signals help the team distinguish those roles, so budget decisions aren't based only on whichever platform produces the largest view count.
For a two-person content team, the biggest benefit may be operational. One person drafts captions, hooks, carousel concepts, and video scenes. The other reviews them, schedules approved content, and checks alerts during the week. The dashboard replaces a scattered spreadsheet with a visible queue and a shared record of what happened.
The creative side still needs judgment. A resource on how to humanize your content strategy can help teams keep AI-assisted drafts conversational, specific, and aligned with real audience concerns. Trendy fits into this workflow as a cross-format workspace for profile auditing, trend and idea discovery, content creation, and performance analysis. It can support Instagram and TikTok planning with hooks, scripts, carousels, visual post concepts, and written posts for other networks.
Putting It All Together With an AI Co-Pilot
A dashboard becomes useful when each signal leads to a decision. Set up this workflow during the coming week:
- Connect your primary accounts: Start with the channels where you publish consistently.
- Choose three north-star KPIs: Match them to your goal, such as saves for useful content, profile visits for interest, or link clicks for traffic.
- Schedule a review: Choose a recurring time to decide what deserves another version.
- Define alert actions: Prepare responses for a reach drop, save spike, comment surge, or publishing error.
- Turn insight into an asset: Convert one finding into a hook, ready-to-shoot script, carousel, visual concept, or platform-specific post.
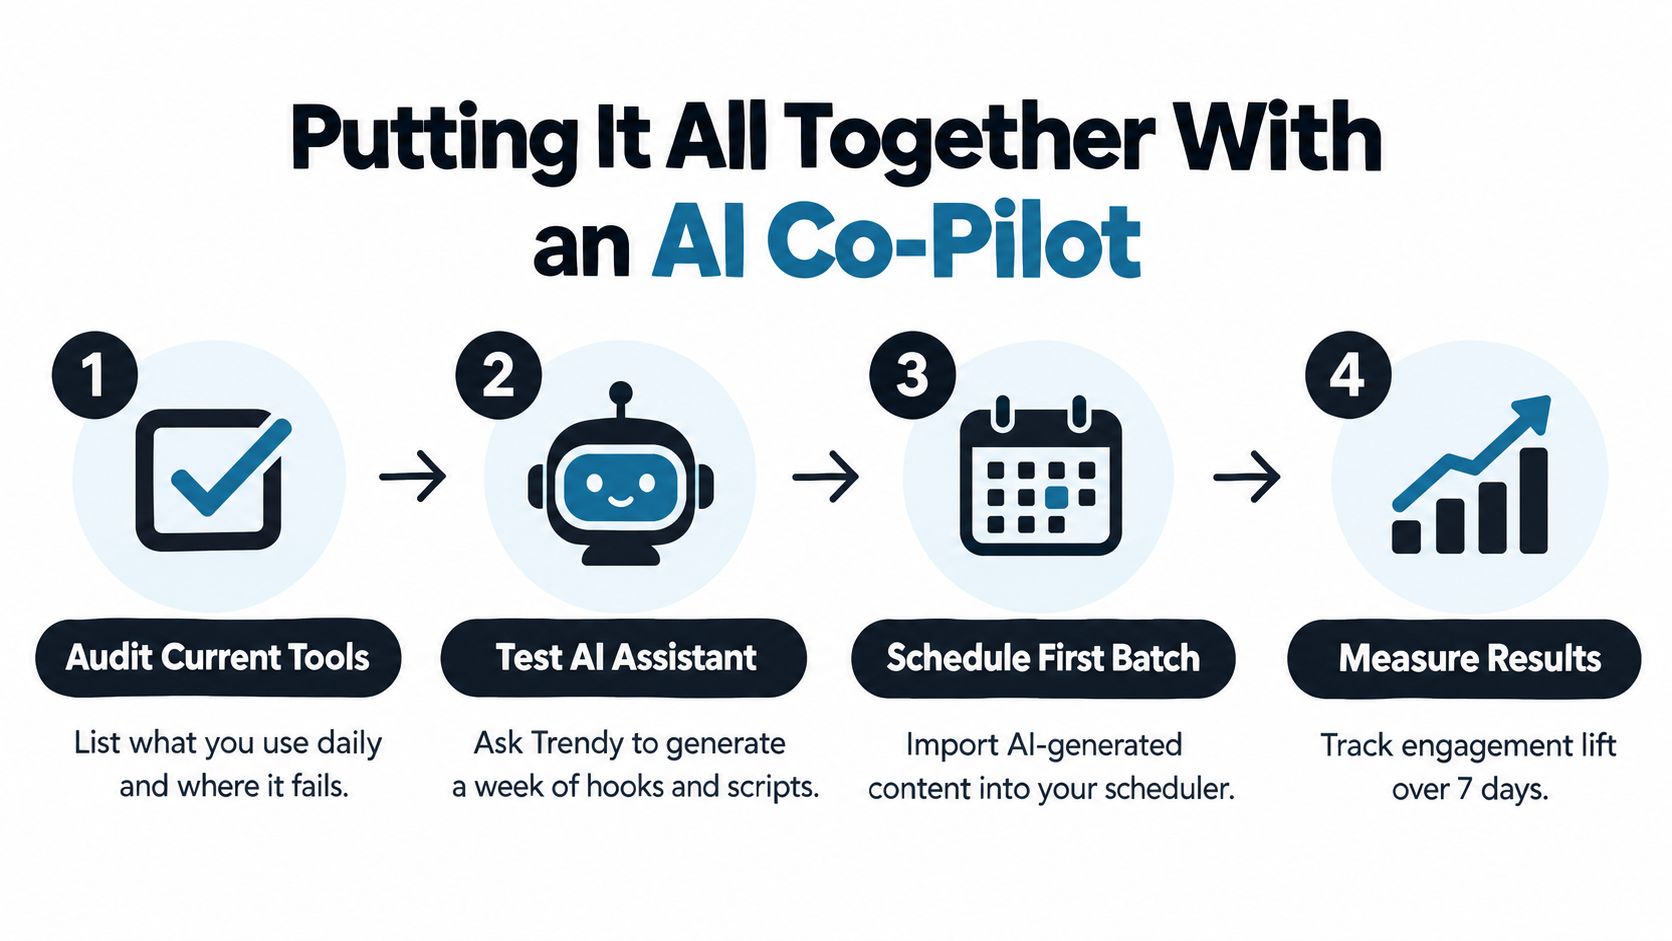
A traditional dashboard shows what happened. An AI co-pilot helps decide what to make next. This guide to AI social media co-pilots explains how audits, trend discovery, ideas, creation, scheduling, and analysis can form one working loop.
Trendy is an AI-powered social media co-pilot for creators, small businesses, and social media teams. It can analyze connected Instagram and TikTok profiles, suggest ideas and hooks, support ready-to-shoot scripts, and adapt concepts into Reels, TikToks, carousels, LinkedIn posts, and Threads or X posts. Use the Trendy iOS app, install the Trendy Android app, or work from the Trendy web app.
Use the result of each review to create, publish, and measure the next piece of content. Visit Trendy today, connect your main accounts, and give your next dashboard insight a clear action.