
You’re posting. You’re checking Insights. You’re seeing reach, impressions, profile visits, saves, and a few charts that look important. But your next question is still the same: what am I supposed to do with this?
That’s where most creators get stuck.
Instagram gives you data, but it doesn’t always give you interpretation. One post reaches a lot of people but gets weak engagement. Another gets fewer views but stronger saves. Your Stories feel active, yet follower growth barely moves. After a while, the numbers stop feeling useful and start feeling noisy.
Tools like Iconosquare exist for exactly this reason. They don’t replace good creative instincts, but they do make the data easier to read, organize, and act on. If you’ve been searching for instagram analytics iconosquare, you’re probably not looking for more charts. You’re looking for clarity.
A lot of creators hit the same wall.
You stay consistent for weeks. Maybe even months. You post Reels, carousels, Stories, and the occasional promotional post. You check Instagram’s native analytics after every upload. You notice little jumps and dips, but the overall pattern stays fuzzy. Growth feels slower than the effort you’re putting in.
That frustration is normal.
Native Instagram analytics can feel like opening the hood of a car when you only wanted to know why the engine sounds weird. The parts are there. The explanation isn’t. You can see reach, impressions, interactions, and audience activity, but you still don’t know which content style deserves a repeat, which posting window matters most, or whether your audience is becoming more responsive over time.

The confusion gets worse when creators chase the wrong metric. They celebrate likes when saves matter more. They obsess over follower count when reach is shrinking. They panic over one low-performing post when the underlying issue is a pattern across several weeks.
Practical rule: A metric only matters if it changes your next move.
That’s why third-party analytics tools became so popular. They act like translators. Instead of handing you a pile of raw numbers, they organize performance into patterns that are actionable. They help answer questions creators ask every day:
Iconosquare has been one of the established names in that category for a long time. It’s built for people who are ready to stop treating analytics as a scoreboard and start using it like a strategy tool.
If Instagram’s built-in data feels like scattered puzzle pieces, Iconosquare tries to show you the picture on the box.
You open Instagram Insights after a busy week of posting and see a wall of numbers. Reach is up on one post, saves are higher on another, Stories look flat, and follower growth barely moved. The problem is not access to data. The problem is having no clear system for turning scattered metrics into a decision.
Iconosquare is built to solve that specific problem. It is a social media analytics platform that pulls Instagram performance into one workspace so creators, marketers, and agencies can review trends over time, compare results across content, and prepare reports without stitching everything together by hand. If you want a clearer foundation before using any tool, this primer on social media analytics fundamentals helps explain what the numbers are for.
Instagram’s native Insights are useful for quick checks. Iconosquare is better suited to ongoing analysis. It gives you a more organized view of audience growth, post performance, engagement patterns, Stories data, and reporting, all inside a well-structured dashboard that is easier to review regularly.
That matters because analytics only become useful when they help you answer practical questions. Which content format keeps attention longest? Are new followers sticking around? Did a campaign create temporary visibility or a lasting lift? A tool like Iconosquare makes those comparisons easier because it keeps historical performance in one place instead of trapping your review inside short time windows.
Iconosquare also has history in this category. It began as Statigram and developed into one of the established names in Instagram analytics. An earlier review of Iconosquare and Instagram business adoption notes that the platform is used to track metrics such as followers, impressions, reach, engagement by post, follower gains and losses, plus Stories analytics and longer-range reporting for connected business accounts. That mix explains why the tool appeals to agencies and serious creators. It covers the questions people usually end up asking after Instagram’s built-in view stops being enough.
A simpler comparison helps here. Instagram Insights works like checking receipts after each day. Iconosquare works more like reviewing the full sales log for the month, sorted by product, timing, and trend. One shows activity. The other helps you spot patterns.
That said, the bigger lesson is not "use more dashboards." It is "learn what decision each dashboard supports." Iconosquare is strong at organizing and reporting traditional analytics. Modern tools such as Trendy push further by adding AI-guided strategy, which helps interpret what to test next instead of only displaying what already happened. So the main reason to bother with Iconosquare is not the charts themselves. It is the chance to move from raw reporting toward a repeatable content strategy.
When creators open an analytics tool for the first time, they often make the same mistake. They scan everything at once.
Don’t do that. A dashboard makes more sense when you read it like a set of business questions. Start with growth. Then content performance. Then audience behavior. That order keeps the data practical.
Your first stop is usually the overview level.
Here, creators want a simple answer: are more people sticking around than leaving? Iconosquare tracks follower growth history, audience size changes, and gained versus lost followers. That matters because raw follower count can hide a churn problem. If you gain followers after a viral Reel but lose them just as fast, the headline number can look healthier than the account really is.
A useful way to read this section is:
If you need a clearer breakdown of one of the most misunderstood top-line metrics, this guide on what impressions mean on Instagram is worth bookmarking.
The dashboard starts earning its keep.
According to this Iconosquare feature review, the platform provides engagement rate heatmaps for Best Time to Post, tracks average likes and comments, shows growth history, highlights top-performing media, and includes media lifespan analysis that reveals how engagement surges early on. That last part is more useful than many creators realize.
Media lifespan tells you how quickly a post gets its reactions. Some posts spike fast and fade. Others build more gradually. If a post consistently gets early traction, that can point to a stronger hook, a better posting time, or a format your audience instantly recognizes.
A post’s first response doesn’t tell you everything, but it often tells you what grabbed attention fastest.
This is also where a well-structured dashboard mindset helps. Even though that resource is about inventory management, the principle carries over. A dashboard works best when it answers decisions, not when it tries to display every possible number.
Audience data is where strategy starts feeling less generic.
Iconosquare’s audience analytics include demographics and follower activity patterns. In practical terms, that helps creators answer questions like whether their content is attracting the people they thought they were speaking to, and whether posting windows align with actual audience behavior.
Here’s the simple version of what to look for:
| Dashboard question | What to check | Why it matters |
| Are the right people finding me | Demographic breakdowns | Helps you match content to the audience you want |
| Are people online when I post | Follower active times | Improves timing decisions |
| Which content type wins | Top-performing media | Helps you repeat formats, not just isolated posts |
| Is engagement healthy | Average likes, comments, engagement rate | Tells you whether viewers are reacting, not just scrolling past |
Creators often get tangled up here.
A high-reach post with low interaction can still be useful if it expands awareness. A smaller-reach post with strong engagement can still be a winner if it deepens trust. The dashboard doesn’t replace judgment. It gives you evidence so your judgment gets sharper.
That’s the core value of instagram analytics iconosquare. It turns random observations into repeatable review habits.
You open Iconosquare on Monday morning. One Reel reached far beyond your usual audience. A carousel got fewer likes but more saves. Stories held attention, yet profile visits barely moved. The dashboard is full of motion, but the main question is simple. What should you do differently this week?
A lone metric is like hearing one instrument and trying to judge the whole song.
Reach tells you who saw the post. Saves suggest usefulness. Profile visits hint at curiosity. Follows, clicks, and replies show whether attention turned into action. Once you group those signals together, the post starts making sense.
A simple way to review any post is to ask three questions:
That framework keeps you from overreacting to vanity metrics. It also helps you spot the difference between awareness content and conversion content, which often play different roles in a healthy Instagram strategy.
If you want a repeatable review habit, this guide on how to track social media analytics across platforms gives a useful process.
Posting-time recommendations help when you treat them like a weather forecast. They improve your odds. They do not guarantee a great post.
As noted on Iconosquare’s platform site, the platform analyzes audience activity and content performance to help users identify stronger publishing windows. Use that insight to test a few consistent time slots over several weeks, then compare what changes in reach, engagement, and downstream actions such as profile visits or follows.
That is the part many creators miss. The goal is not to hunt for one perfect minute. The goal is to find a few reliable windows where your audience is more likely to notice good content.
Modern tools push this idea further. Iconosquare is strong at showing what happened. AI-guided platforms such as Trendy focus more on what to try next, connecting performance patterns to strategic suggestions. One gives you the instrument panel. The other acts more like a coach in the passenger seat.
This usually points to content that traveled well but did not create enough interest to earn a response. The topic may be broad, the cover may attract casual viewers, or the opening may promise more than the post delivers.
Keep the subject if discovery matters. Improve the packaging if you want interaction. A sharper first line, stronger promise, or clearer point of view often helps more than changing the topic entirely.
That is often a good sign, not a warning.
Likes are quick reactions. Saves are delayed value. If people are bookmarking a post, they may be treating it like a reference they plan to revisit. Tutorial carousels, checklists, and educational captions often perform this way.
People may be watching passively. Your sequence held attention, but it did not give viewers a reason to respond.
Add one action step. Use a poll, question box, product tag, teaser for the next post, or a direct invitation to DM. Stories work best when each frame nudges the viewer somewhere specific.
A quick explainer can help if you want to see someone walk through this visually:
Good analysis sounds calm and specific.
Instead of saying the algorithm buried a post, write a short hypothesis. Example: “This Reel reached new viewers, but few visited the profile. Next time I’ll keep the topic, strengthen the closing CTA, and test a clearer cover.” That gives you something to compare.
Creators move beyond reporting. Iconosquare helps you see the numbers clearly. Better strategy comes from translating those numbers into repeatable experiments, then using what you learn to shape the next month of content.
Analytics become useful when they attach to a real job.
A creator and a brand manager might use the same dashboard and care about completely different outcomes. One wants better content decisions. The other needs cleaner reporting. Iconosquare fits both, but the way each person uses it looks different.
A coffee shop runs a seasonal campaign and wants to know whether Instagram is helping. The owner checks post performance, Story activity, and profile actions to see which creative led people to visit the profile or click through.
The win here isn’t “more analytics.” It’s being able to compare promotional posts against regular lifestyle posts and notice what drives intent. If menu graphics get reach but behind-the-scenes videos drive profile actions, the business learns how to blend both.
A fashion creator needs cleaner numbers before pitching brands.
Instead of manually screenshotting native insights, they use dashboard-level audience and performance views to pull together a sharper story: who the audience is, which content formats perform best, and how engagement has looked over time. That makes sponsorship conversations less hand-wavy and more professional.
Brands don’t just want proof that people saw your content. They want proof that the right audience responds to it.
Here, reporting tools are most critical.
A manager handling several accounts often needs to turn analytics into something a client can read in minutes. Iconosquare’s reporting features help package recurring metrics into cleaner summaries, which makes month-end reporting less painful than manually gathering screenshots from each account.
If you already build recurring summaries, a practical social media reporting template can help you structure the story around outcomes instead of dumping metrics onto a page.
You don’t need a flashy presentation. You need a report that answers five things:
That structure works for solo creators too. If your analytics review doesn’t lead to a specific change, it’s not really a review. It’s a recap.
Most creators aren’t choosing between “analytics” and “no analytics.”
They’re choosing between levels of help.
Some only need the free baseline inside Instagram. Some need a dedicated reporting and analytics platform like Iconosquare. Others want a newer layer of help that doesn’t just explain what happened, but helps shape what to post next.
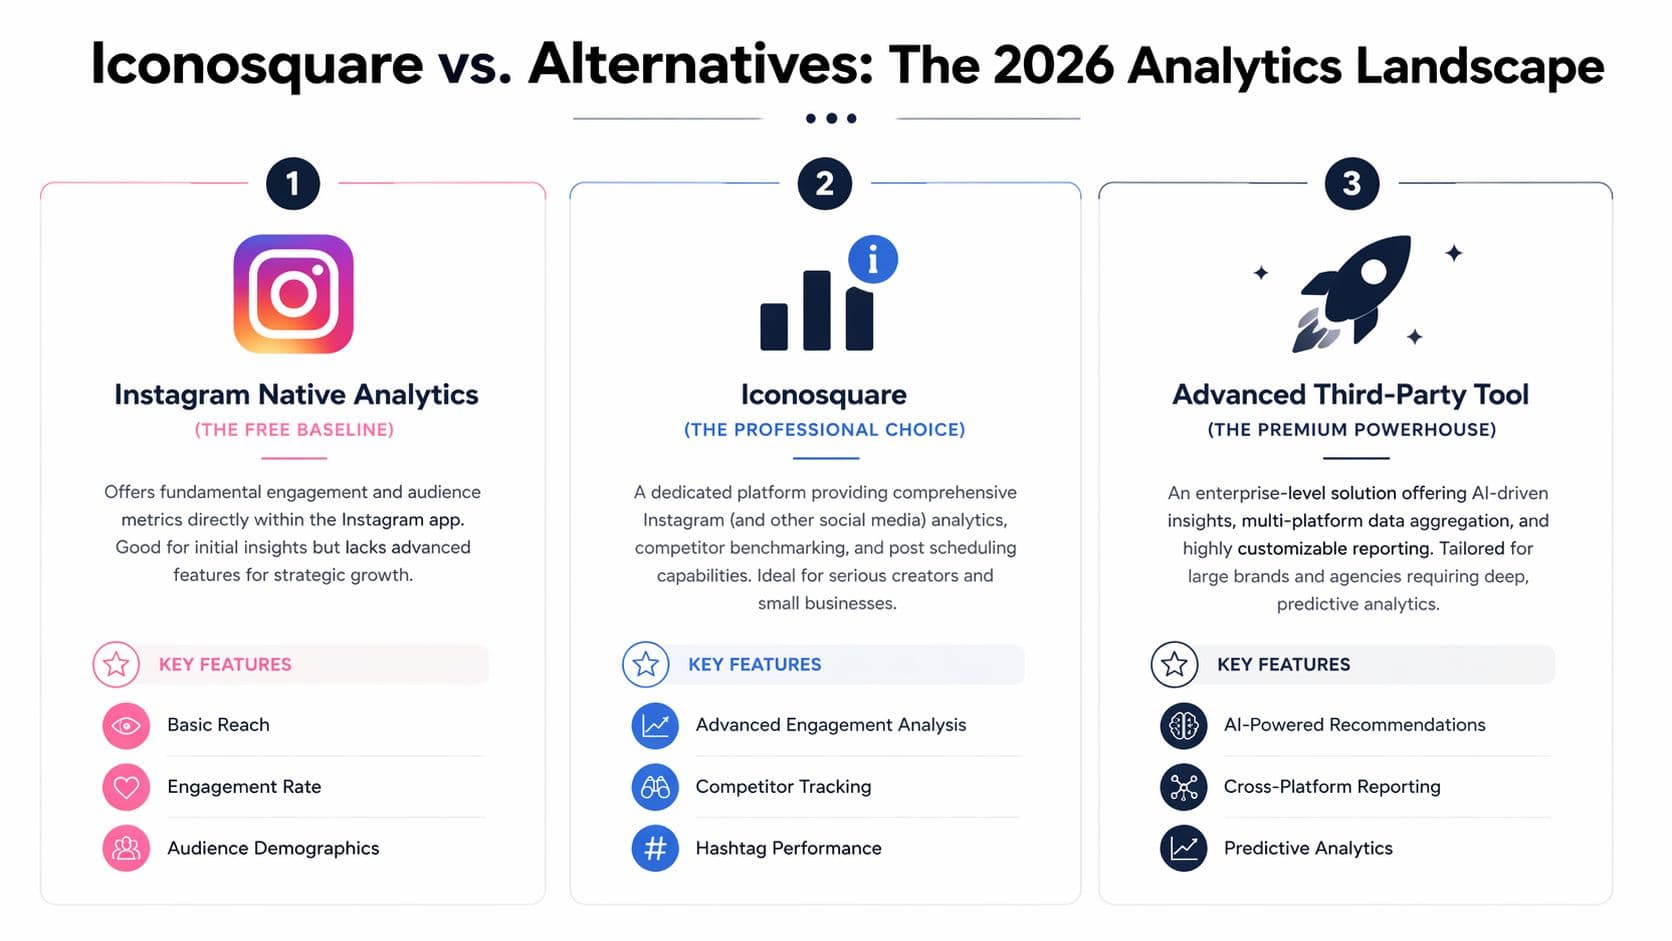
Instagram’s own analytics are the free baseline. That’s their biggest advantage.
You can quickly see top-line performance, audience activity, and content-level feedback without adding another platform to your workflow. For many creators, that’s enough in the early stage. If you’re posting casually or still learning your voice, native Insights may cover the basics.
The problem appears when you want more structure. Native analytics can feel scattered. They’re fine for checks. They’re weaker for deep pattern analysis and polished reporting.
Iconosquare is a stronger fit when you need a dedicated workspace for analytics.
Its value is in organization, historical analysis, audience detail, media comparison, and cleaner reporting workflows. It’s well suited to serious creators, small businesses, consultants, and agencies that review accounts regularly and need more than a quick in-app look.
Where it can feel heavy is the same place it shines. You get more data, which means you also need better judgment. Iconosquare tells you a lot about what happened. It doesn’t always answer the strategic follow-up for you. You still have to interpret patterns, prioritize actions, and decide what to test next.
This is the shift many creators care about in 2026.
Traditional dashboards are great at reporting the past. Modern AI-guided tools are built to shorten the distance between insight and action. Instead of only showing your top post, they help turn that into your next content angle. Instead of only showing active times, they help you plan around those windows. Instead of only showing format winners, they help surface repeatable ideas in your niche.
That’s a different job.
If Iconosquare is the analyst in the room, AI-guided platforms are closer to a strategist who also helps you plan the next move. That makes them appealing to creators who don’t just want to understand performance. They want help producing the next week of content with less guesswork.
If you’re comparing categories more broadly, this roundup of Instagram analytics tools can help frame what each type is really for.
| Feature | Instagram Native | Iconosquare | Trendy |
| Cost barrier | Free baseline | Paid professional tool | App-based strategic tool |
| Depth of analytics | Basic in-app metrics | Deeper dashboard reporting and historical analysis | Focuses on strategy guidance alongside performance insight |
| Reporting workflow | Limited | Better for recurring reports and organized reviews | Better for creators who want simpler direction |
| Best use case | Casual checks and early-stage creators | Serious creators, businesses, managers, agencies | Creators and small teams who want help deciding what to post next |
| Main limitation | Less depth and structure | More interpretation required | Less about traditional analyst-style reporting |
Use native analytics if you’re still learning the basics.
Use Iconosquare if you need stronger analysis, trend reading, and reporting discipline.
Use an AI-guided platform if your bigger problem isn’t “Where do I find the data?” but “What should I create next based on this data?”
That’s the split many people miss. Better analytics and better strategy are related, but they aren’t the same thing.
Iconosquare is a strong choice for people who want a serious analytics layer on top of Instagram.
It works well when you care about historical context, cleaner dashboards, audience detail, and recurring reports. If you manage multiple accounts, prepare client updates, pitch brands, or review performance with a team, the tool makes a lot of sense. It turns scattered Instagram numbers into a more structured operating system.
But there’s a tradeoff.
The deeper the dashboard gets, the more interpretation it asks from you. That’s fine for analysts, strategists, and experienced marketers. It’s less ideal for creators who are already stretched thin and mainly want direct guidance. If your real pain point is not reporting but deciding what to post, a traditional analytics tool can still leave you doing a lot of mental work on your own.
That’s the key distinction.
Choose Iconosquare if you want to analyze performance with more rigor. Look elsewhere if you want a tool that behaves more like a strategic assistant than a reporting platform. Plenty of creators don’t need another dashboard to stare at. They need help turning performance patterns into a practical content plan they can execute.
The best tool is the one that closes your biggest gap. For some people, that’s data depth. For others, it’s decision speed.
If you want help not just reading performance but turning it into your next content plan, try Trendy. It’s built to give creators and brands AI-powered guidance for Instagram and TikTok, including personalized content ideas and strategy support. You can also download Trendy on iOS or Android.
