
A TikTok engagement rate of 4.86% in 2026 sounds definitive, until you learn that follower-based engagement has softened to roughly 2.60%, while view-based engagement has held around 4.20%–4.30% across five consecutive quarters, according to Socialinsider's TikTok benchmarks. The same account, the same content, and the same interactions can produce very different scores depending on the denominator.
That's why a TikTok engagement calculator should be treated as a diagnostic tool, not a vanity widget. The useful question isn't “What's my rate?” It's “Which rate matches the decision I'm trying to make?”
Why Your TikTok Engagement Score Is Probably Misleading You
TikTok's average engagement rate is reported at 4.86% in 2026, but that headline conceals two different stories. Follower-based engagement has fallen to approximately 2.60%, while view-based engagement has remained between 4.20% and 4.30% across five consecutive quarters, as documented by Socialinsider.
Those figures aren't minor rounding differences. They answer different questions. Follower-based engagement asks how much of your declared audience interacted. View-based engagement asks how strongly the content resonated with the people who watched it.
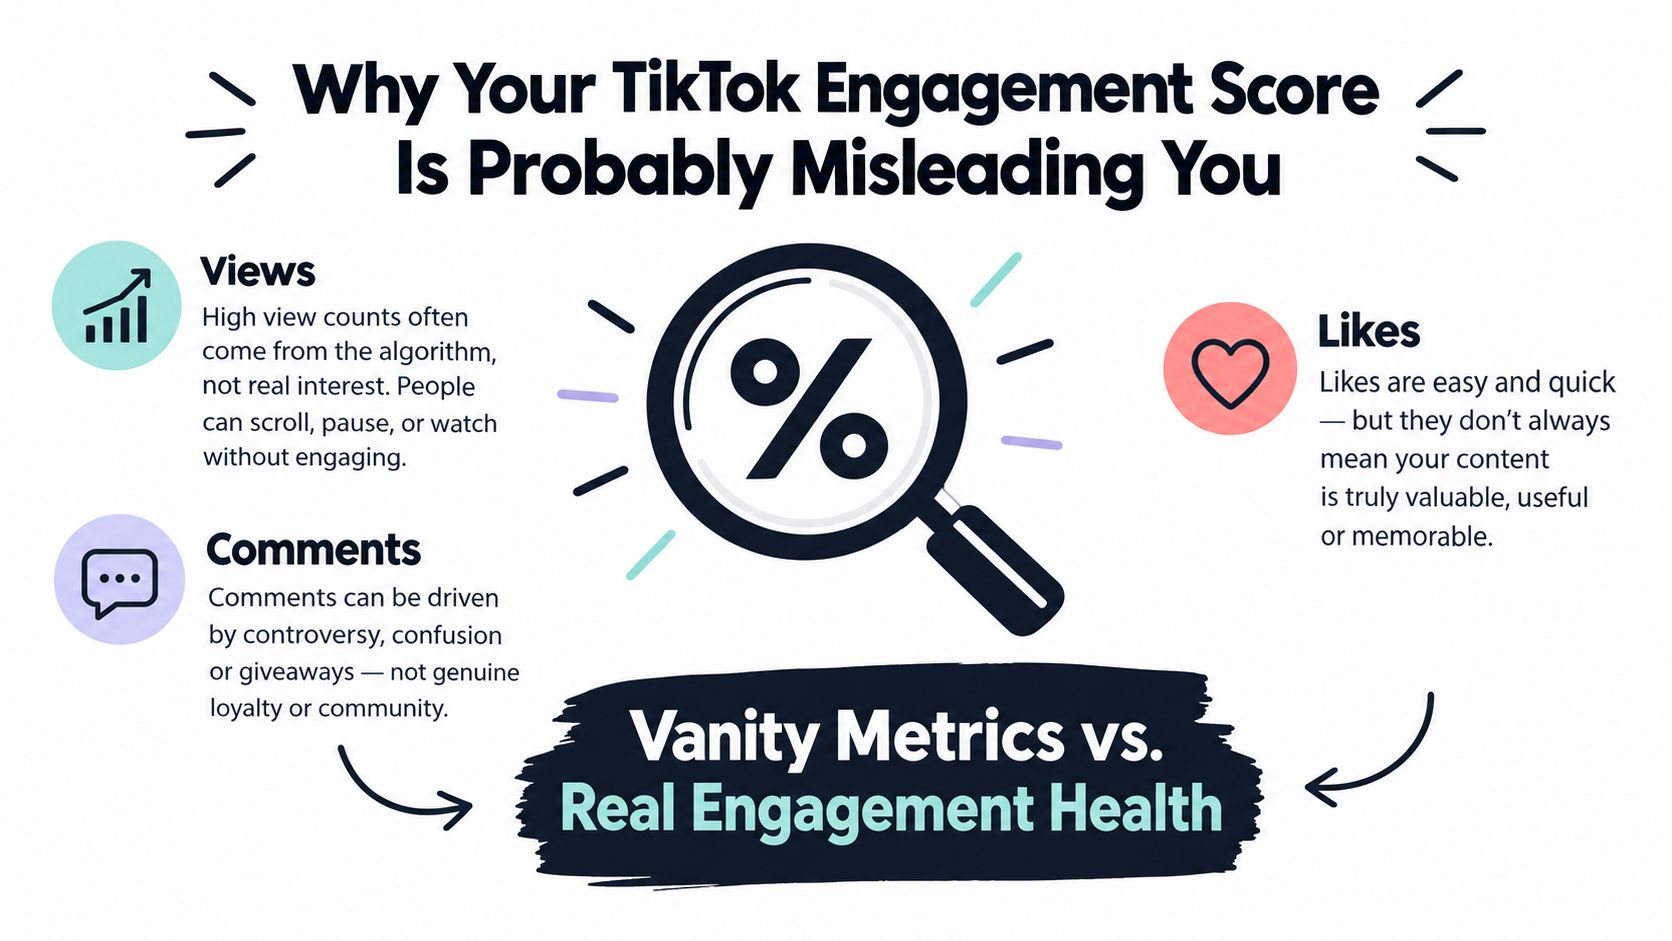
The denominator changes the diagnosis
TikTok distributes videos through a feed that can expose content far beyond an account's follower base. A creator with modest audience ownership can therefore earn substantial reach, while a larger creator can publish a video that receives comparatively limited distribution.
A calculator that reports one percentage without naming its denominator leaves out the most important piece of context. It can make a small account look unusually strong on followers, or make a widely distributed video look weak when judged against a much larger audience base.
Practical rule: Never record a TikTok engagement score without recording whether it uses followers or views.
This matters for campaign planning too. If you're evaluating content before deciding whether to launch TikTok ads faster, view-based engagement can help reveal whether the creative earned meaningful interaction from its actual exposure. It still won't replace conversion analysis, but it gives you a more relevant read on content resonance.
A useful audit keeps both numbers, then assigns each one a job. Use follower-based engagement to understand audience participation and view-based engagement to evaluate the strength of the individual video. The calculator becomes misleading only when someone treats either score as a universal measure of creator quality.
The Two Core TikTok Engagement Formulas
A TikTok engagement calculator can produce two very different scores from the same post. The difference comes from the denominator, not the interaction count. Both formulas typically total likes, comments, shares, and saves, as described in Socialinsider's calculator methodology. Record that numerator clearly before comparing accounts or posts.
Formula one, engagement by followers
ER by followers = (Likes + Comments + Shares + Saves) ÷ Followers × 100
Use:
- Likes for positive reactions.
- Comments for visible conversation.
- Shares for distribution behavior.
- Saves for future-use intent, especially with tutorials, recipes, checklists, and educational videos.
- Followers for the account's declared audience size at the time of analysis.
Follower-based engagement measures participation relative to the community the creator has already built. It fits audience-health reviews, media kits, and brand pitching, where an established audience's response is part of the commercial case. Apply it consistently across posts with a stable follower reference point.
Some calculators leave out saves and count only likes, comments, and shares. That method can understate educational content, where saving a video may signal stronger intent than a like. If TikTok analytics provides save data, include it and disclose the choice.
Formula two, engagement by views
ER by views = (Likes + Comments + Shares + Saves) ÷ Views × 100
Here, views represent the video's recorded exposure. The denominator therefore fits TikTok's distribution model, where a post can reach people outside the follower base.
Use view-based engagement to assess creative resonance, compare videos with different reach, and evaluate discovery performance. It answers a different question from follower-based engagement: did the content earn interaction from the people who watched it? For a practical explanation of the calculation options, see Trendy's engagement rate calculator guide.
Profile averages need a defined method
For an account-level score, choose a consistent post sample and time window. Total engagements across those posts, divide by the number of posts to get average engagements, then divide by the relevant follower or view base and multiply by 100. Alternatively, calculate each post's rate first and average those rates. These methods can produce different results, so label the method rather than presenting one percentage as definitive.
Every report should identify the numerator, denominator, post sample, and averaging method. Keep both formulas when possible. One supports audience participation analysis, while the other shows how effectively individual videos convert exposure into interaction.
Follower-Based vs. View-Based, Choosing the Right Formula for Your Goal
Neither formula is universally correct. The right choice depends on the decision waiting at the end of the calculation.
Follower-based engagement is useful for brand pitching and audience-health analysis. A prospective partner may want to know how actively a creator's established audience responds to published content. It also provides a relatively stable comparison point as the account publishes repeatedly.
View-based engagement is the stronger technical standard for short-form video because it normalizes interaction against feed distribution. Benchmark sources place healthy TikTok engagement by views in roughly the 4%–8% range, with 10% or more indicating exceptional viral performance, according to Influentials' calculation guidance.
Match the metric to the decision
| Creator decision | Primary formula | Why it fits |
| Audience health | ER by followers | Shows interaction relative to the declared community |
| Content discovery | ER by views | Shows whether the video resonated with actual viewers |
| Brand pitching | ER by followers, plus ER by views | Separates community loyalty from content reach |
| Monetization readiness | Both formulas, with business outcomes | Shows audience participation and creative distribution |
| Video testing | ER by views | Compares content performance despite different reach |
Consider a video with 1,000 total engagements, 10,000 followers, and 50,000 views. Its follower-based rate is 10%, while its view-based rate is 2%. The arithmetic is identical, but the interpretation changes sharply. The account's established audience responded actively, yet the video's wider distribution produced comparatively limited interaction.
The reverse can happen when a video travels well beyond its follower base. A smaller account may have fewer total likes and comments than a large account, but still produce a stronger view-based rate because a larger share of viewers interacted.
That's the small-account paradox. Accounts under 5K followers can outperform larger accounts on engagement by views even when their absolute interaction and view totals are lower, a pattern highlighted in Socialinsider's TikTok benchmarks. For discovery, use views. For a partnership conversation, show both.
A calculator should therefore produce a small dashboard, not a single trophy number. If you're comparing exposure quality, you can also use Trendy's explanation of impressions versus views to keep distribution metrics separate from interaction metrics.
Worked Examples with Real TikTok Account Numbers
The denominator can change the conclusion. These examples apply both formulas and include saves in total engagement.
Mid-size lifestyle creator
A lifestyle creator with 42K followers posts a video that receives 180K views, 9,400 likes, 640 comments, 1,200 shares, and 3,100 saves.
Total interactions:
9,400 + 640 + 1,200 + 3,100 = 14,340 engagements
The two rates are:
- ER by followers: 14,340 ÷ 42,000 × 100 = 34.1%
- ER by views: 14,340 ÷ 180,000 × 100 = 7.97%, approximately 7.9%
The 7.9% view-based rate indicates strong interaction relative to actual distribution. The 34.1% follower-based result answers a different question: it compares engagements with the account's follower base. It does not mean that 34.1% of followers watched or interacted with this specific video.
For discovery analysis, the view denominator is more useful because the video reached far beyond the account's existing audience. For a brand pitch, retain both figures. The follower rate describes the account's owned audience context, while the view rate shows how efficiently this video converted exposure into interaction.
Smaller food creator
A food creator with 8K followers publishes a video that earns 22K views, 1,100 likes, 210 comments, 480 shares, and 920 saves.
Total interactions:
1,100 + 210 + 480 + 920 = 2,710 engagements
The results are:
- ER by followers: 2,710 ÷ 8,000 × 100 = 33.9%
- ER by views: 2,710 ÷ 22,000 × 100 = 12.3%
The smaller account has fewer followers and fewer total interactions, yet its 12.3% view-based rate exceeds the lifestyle creator's 7.9%. That makes it the stronger signal for judging this video's response among viewers, even though the account has less reach.
The 920 saves matter for a recipe video. Removing them would understate the post's practical value and lower both rates. A calculator should therefore preserve saves in the numerator, then report follower-based and view-based results side by side rather than compressing performance into one headline score.
How to Use the Interactive TikTok Engagement Calculator and Spreadsheet
A practical calculator should let you enter likes, comments, shares, saves, followers, and views, then return both follower-based and view-based engagement. Don't hide one score behind the other. The comparison is the point.
Start with TikTok analytics and collect the interaction fields for each video you want to evaluate. Views and follower counts provide the denominators, while saves may require a closer look inside creator analytics rather than relying only on the public video display.
Use a consistent sample
A single post can be useful for diagnosing a creative, but it's a weak account summary. A multi-post sample gives you a better sense of whether the result reflects a repeatable content pattern or one unusual distribution event.
Record each video in a spreadsheet with columns for:
- Post date: Keeps the sample chronologically useful.
- Format and topic: Helps separate tutorials, trends, reviews, comedy, and other creative types.
- Views: Used for view-based normalization.
- Likes, comments, shares, and saves: Used to calculate total engagement.
- Followers at publication: Preserves the correct context for follower-based analysis.
- Calculated rates: Keeps both denominators visible.
- Notes: Captures hooks, sounds, length, and audience response.
For an external reference point while you build your sheet, Sup's TikTok creator performance calculator can help with basic rate calculations. Treat any tool as trustworthy only when it shows the formula and denominator it uses.
Turn calculation into an audit
The more useful workflow is to calculate the rates, group posts by format and topic, and then inspect the patterns. Trendy's Performance Analysis workflow is designed to reduce that manual comparison across a creator's post history, so you can examine engagement trends instead of entering every video one by one.
Run a full profile audit at heytrendy.app, then use the Trendy iOS app or Android app to monitor how performance changes over time. The iOS application is another way to review the account workflow on mobile.
The output you need isn't just “high” or “low.” It's a list of posts that consistently outperform, formats that attract saves, and videos whose view-based rate rises without a matching follower-based increase. Those patterns tell you what to make next.
TikTok Engagement Benchmarks by Niche and Follower Tier
A single benchmark can misclassify a post. A cooking tutorial, comedy clip, and beauty review invite different actions, so comparing each with a platform-wide average can hide genuine performance.
A broad reference range is 4%–8% engagement by views, with 10% or more indicating exceptional performance, according to Influentials. Socialinsider reports TikTok engagement by views at 4.20% in 2025, ranging from 4.20% to 4.30% across five quarters, while follower-based engagement was approximately 2.60% in 2026. Use these figures for orientation only. They cannot decide whether a post is strong within its niche or follower tier.
What can be benchmarked responsibly
Verified evidence does not provide defensible 2026 rate ranges for every requested niche and follower tier. Filling cells for beauty, fitness, food, education, or comedy with unsupported figures would create false precision. The table below is therefore a measurement framework, not a published benchmark set:
| Niche | ER by Views, Micro under 10K | ER by Views, Mid 10K–100K | ER by Views, Macro 100K+ | ER by Followers, Average |
| Beauty and fashion | Calculate from your sample | Calculate from your sample | Calculate from your sample | Calculate from your sample |
| Fitness and wellness | Calculate from your sample | Calculate from your sample | Calculate from your sample | Calculate from your sample |
| Food and cooking | Calculate from your sample | Calculate from your sample | Calculate from your sample | Calculate from your sample |
| Education and how-to | Calculate from your sample | Calculate from your sample | Calculate from your sample | Calculate from your sample |
| Comedy and entertainment | Calculate from your sample | Calculate from your sample | Calculate from your sample | Calculate from your sample |
Build the comparison from your own posts, separated by niche, format, and audience size. Keep the denominator consistent within each comparison. View-based rates are useful for discovery because they show how actively reached viewers responded. Follower-based rates are more relevant when assessing community strength or preparing a brand pitch.
Interaction mix also changes the interpretation. Educational and tutorial posts may earn more saves, while comedy and trend-led content may generate wider reach without the same save behavior. A similar total rate can therefore represent different outcomes.
Use Trendy's performance benchmarking guide to structure a comparable sample. Record both denominators, compare similar formats, and label a post underperforming only when it falls below a relevant niche and audience baseline. For monetization readiness, examine whether strong rates repeat across posts rather than relying on one viral result.
What Your Engagement Score Signals About Content Quality
A high engagement score can reflect strong content, a trend-driven spike, or controversy that attracted attention without building trust. The percentage shows the level of interaction, not its cause. That distinction matters because the same post can produce a strong view-based rate while contributing little to repeatable audience growth.
TikTok's trend intelligence emphasizes authenticity and creative fit over raw interaction volume. Its 2025 trend report discusses brand fusion, identity osmosis, and creative catalysts. It also reports that videos under 90 seconds saw declining reach and interactions in 2025, while educational and commerce-led formats continued to grow, as described in TikTok's What's Next report.
Separate spikes from patterns
A viral post often creates a sharp peak without proving that the same creative approach will work again. Stronger evidence comes from several posts sharing a topic, format, or audience promise.
Record context beside every calculated score:
- Creative trigger: Was the post built around a trend, recurring series, reaction, or original expertise?
- Interaction mix: Did viewers mainly like, comment, share, or save?
- Audience quality: Did comments show relevance, questions, or intent to follow up?
- Repeatability: Do similar videos produce comparable results?
- Format context: Was it a comedy clip, tutorial, product demonstration, or live-related cutdown?
A saved recipe and a quick like carry different implications. A share may signal practical relevance, while a comment may reflect disagreement. The total rate is a screening metric. Its composition points to the audience response that deserves attention.
Read content quality through trends
A rising rate across a consistent run of posts provides stronger evidence than one outlier. Apply the same denominator throughout the sample, then compare results with the topic, hook, structure, and format. That process creates a testable quality hypothesis instead of a number to celebrate in isolation.
Use this analysis to match the metric to the decision. View-based engagement helps assess discovery and reach quality. Follower-based engagement better reflects community response and supports brand-pitch evaluation. Monetization readiness requires repeatable performance across related posts, not a single viral result. The social media analytics guide supports connecting these metrics with publishing decisions, so the key question becomes whether the hook, format, and audience promise can be reproduced without another accidental spike.
Turning Your Engagement Score into a Growth Action Plan with Trendy
A score becomes useful only when it changes what you publish. Compare follower-based and view-based rates, then interpret the gap. Follower rate reflects response from your existing community and supports brand pitching. View rate shows whether content earns interaction beyond the follower base.
- Audit the profile. Find posts that lower the account average and those that repeatedly earn strong view-based engagement.
- Separate content types. Compare tutorials, trend participation, reviews, comedy, carousels, and other formats instead of blending them.
- Identify the creative lever. Review the hook, scene structure, topic, sound, hashtags, and call to action.
- Plan the next batch. Create ready-to-shoot scripts, hooks, scene structures, carousels, visual concepts, and platform-specific posts based on the strongest patterns.
- Measure the next cycle. Recalculate both rates across multiple posts. A single spike does not establish improvement.
Trendy supports content work across TikTok, Instagram, Threads, and X. Its Profile Audit, Trends and Ideas, Content Creation, and Performance Analysis workflows connect a calculator result to a specific publishing change. The AI social media action plan is useful when the decision is which lever to test next, rather than which headline percentage to report.
Trendy lets you calculate both TikTok engagement rates, compare content patterns, and turn the findings into scripts, hooks, and cross-platform posts. Connect your profile, review the numbers, and track whether the next content cycle improves audience response.