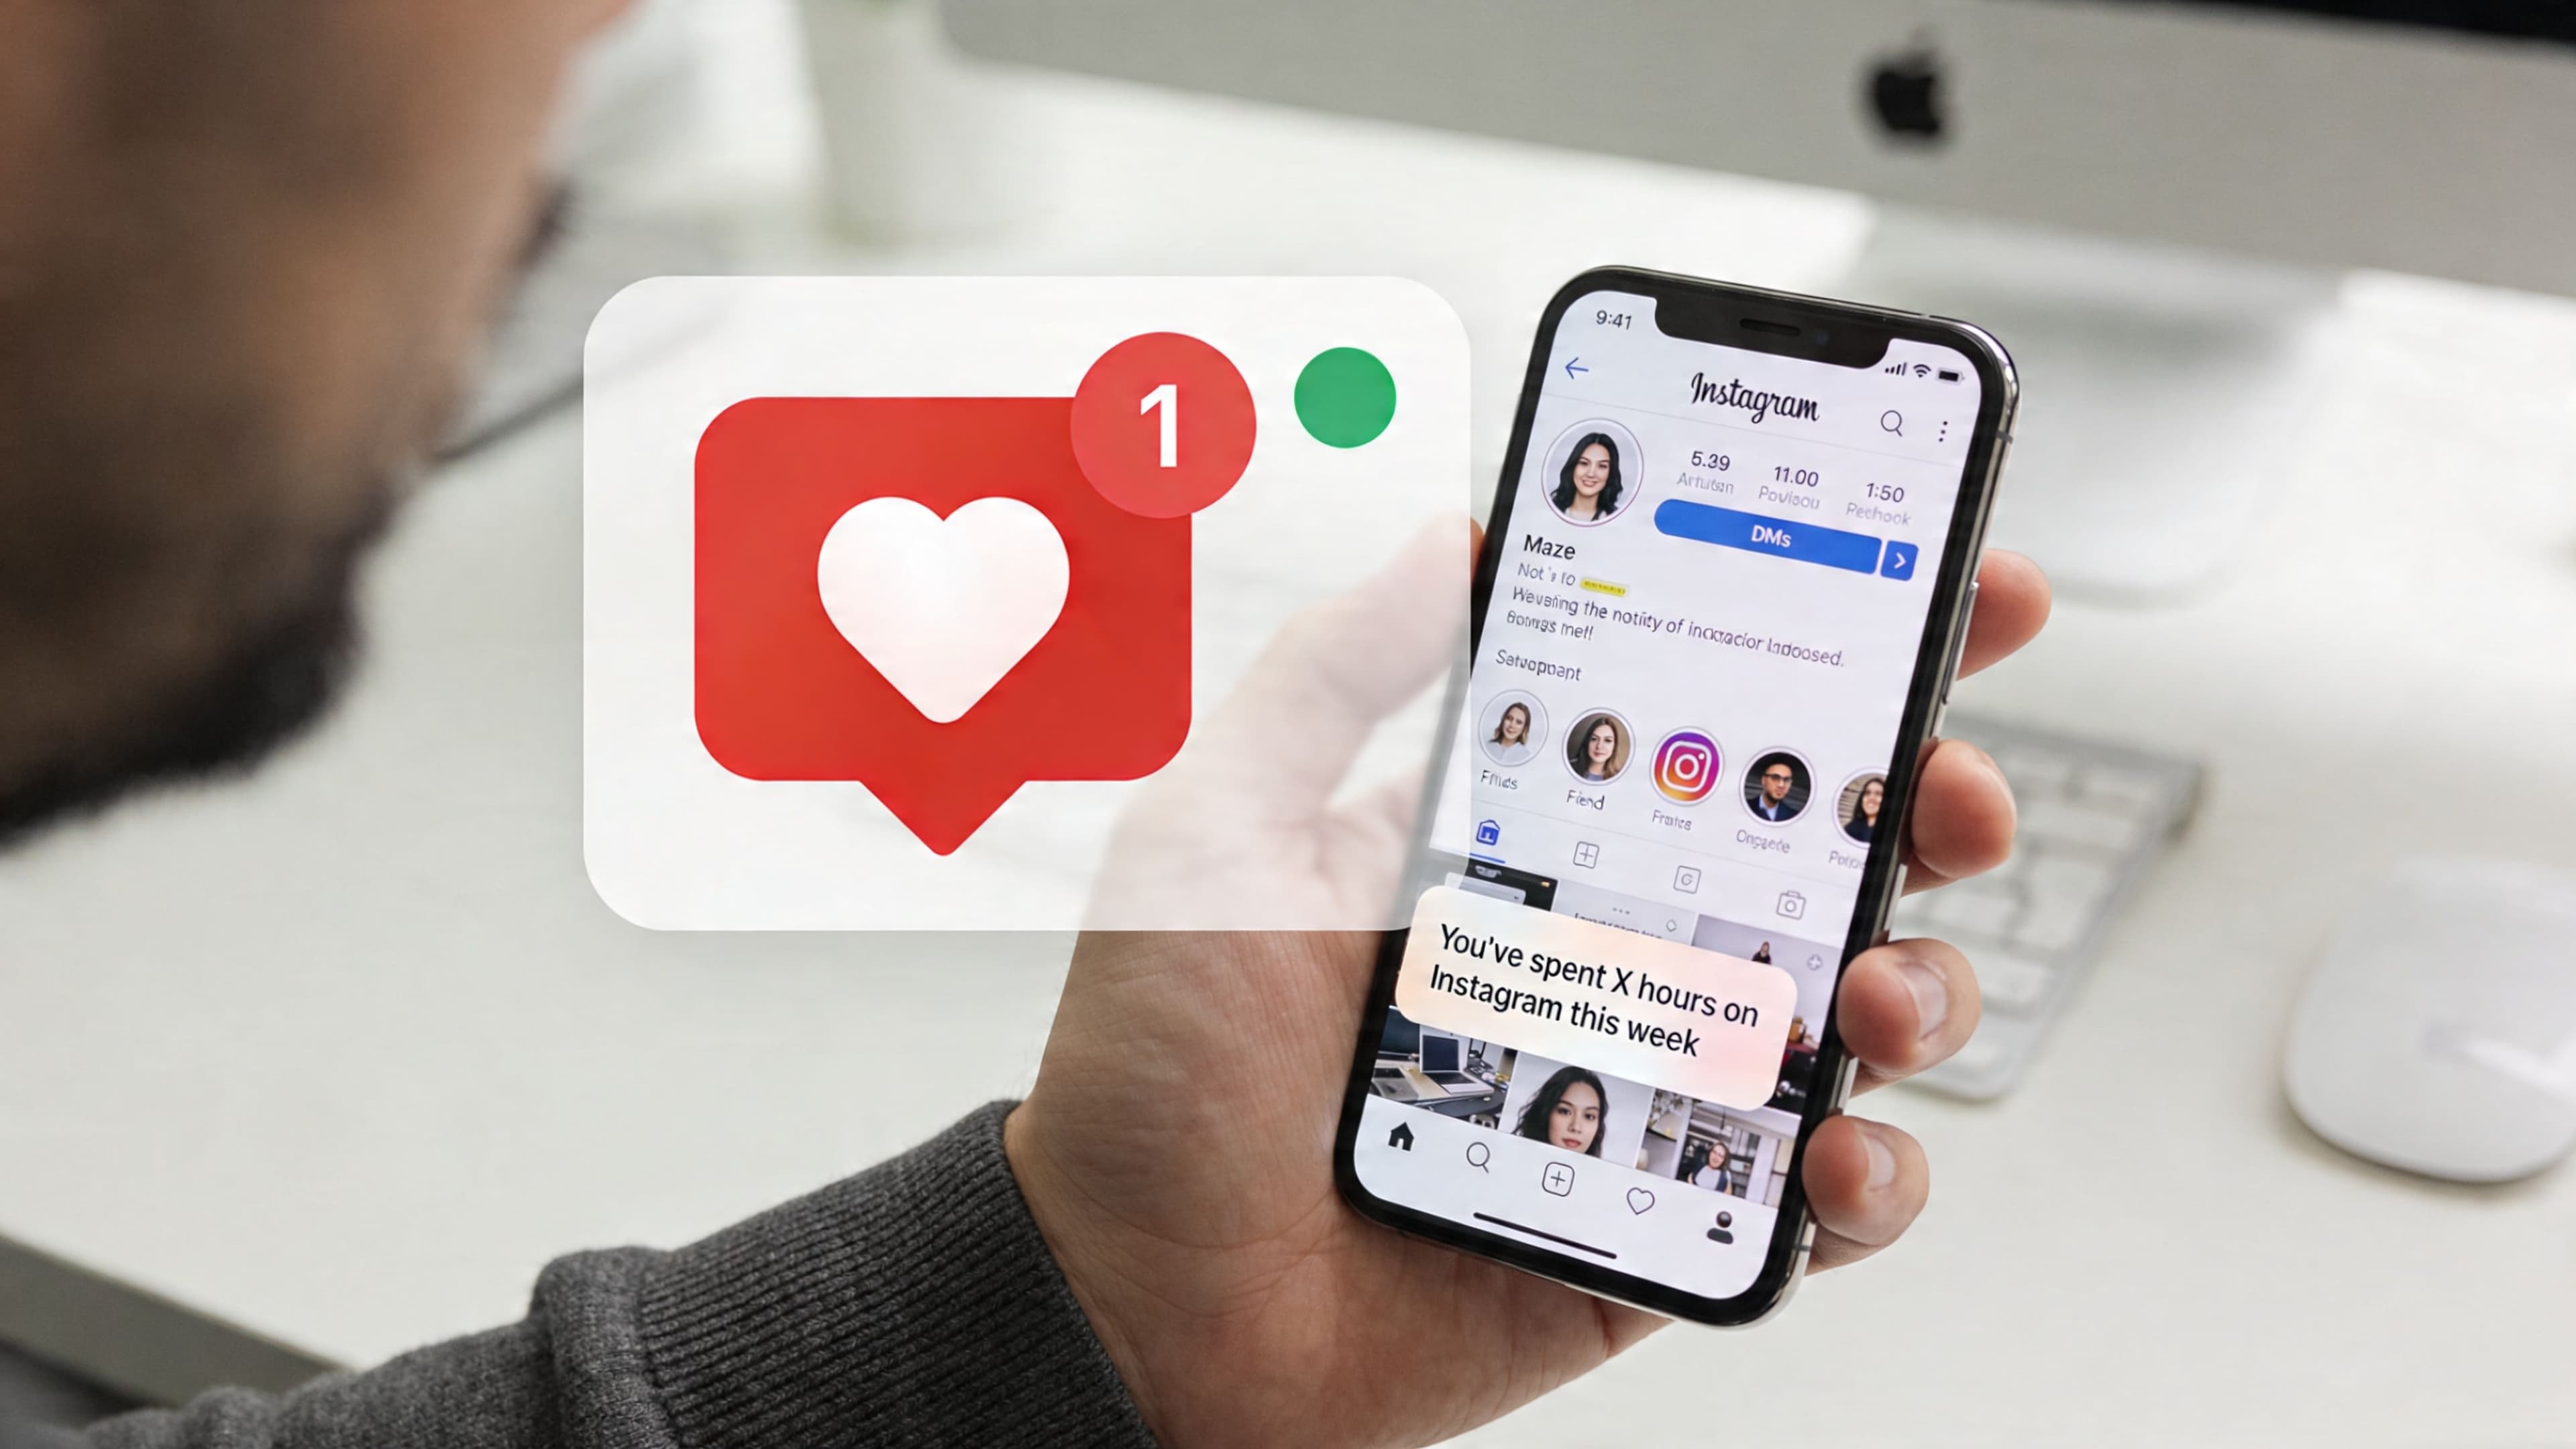
You tap Instagram to “check activity” for a minute. Then the minute turns into a tour of four different dashboards that all sound like they were named by the same tired committee.
First you see likes, comments, follows, and random notifications. Then there’s the little green dot showing who’s active. Then Instagram politely roasts you with a time-spent report. Then, if you have a professional account, you find charts, reach numbers, profile actions, and enough tiny labels to make you feel like you accidentally opened airplane controls.
That confusion is normal. The phrase activity in instagram doesn’t mean one thing. It means several completely different systems jammed under one familiar word. For creators, that’s annoying. For growth, it matters. If you mix them up, you’ll spend energy on the wrong signals and miss the numbers that shape reach.
A creator usually notices the problem in the middle of a very ordinary day. You post a Reel, check the heart tab, see a burst of notifications, notice a friend’s green dot in DMs, then later get a “your activity” summary about time spent on the app. By evening, you’re buried in Insights trying to remember whether “activity” meant people liking your post, people being online, or you spending too long watching dog videos.
The platform is huge, which makes this mess more important, not less. Instagram reached over 2 billion monthly active users in 2025, and users spent an average of 15 hours and 50 minutes monthly on the app, according to these Instagram usage statistics from Sked Social. When that many people spend that much time in one app, creators can’t afford to guess what each dashboard is telling them.
The issue isn’t that Instagram gives you too much data. It’s that it gives you several different kinds of data that answer different questions.
Practical rule: If a dashboard doesn’t help you decide what to post, when to post, or what to stop doing, it’s not a growth dashboard. It may still matter. It’s just solving a different problem.
Many creators only realize this after chasing the wrong rabbit. They celebrate a noisy notification tab while their reach stalls. Or they obsess over screen time while ignoring the post format that keeps earning saves and shares. If you want a cleaner framework for reading social data in general, this guide to social media analytics basics helps connect the dots.
Instagram activity is more effective when viewed like a car dashboard. One gauge tells you someone texted you. Another shows whether the engine is warm. Another warns you you’ve been driving for too long. Another tells you whether the car is performing well.
Those aren’t the same signal. Neither are Instagram’s.
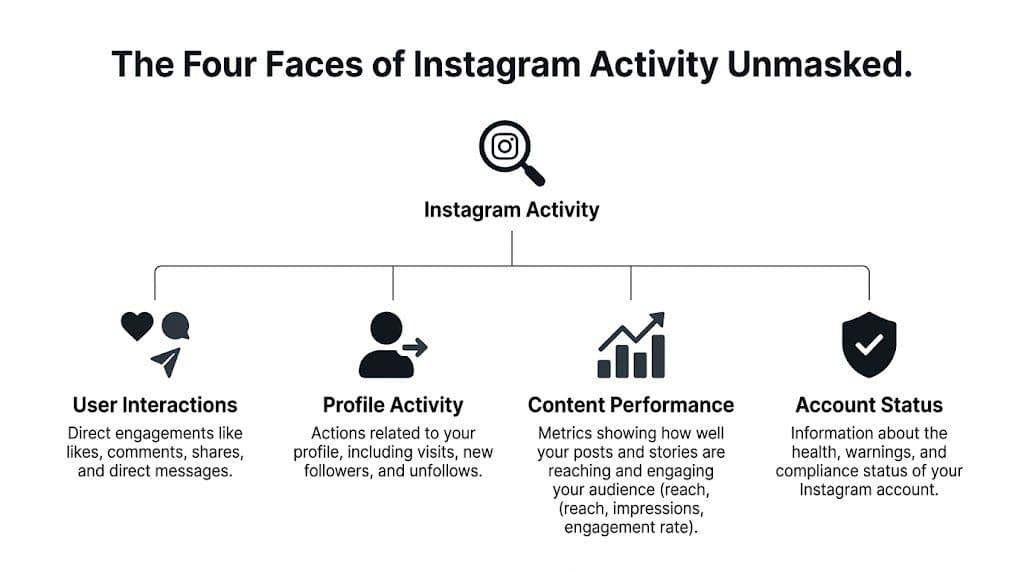
This is the classic heart-tab experience. It shows likes, comments, tags, follows, mentions, and some recommendation-style notifications. It’s useful because it tells you where conversations are happening and which content is getting an immediate reaction.
It’s also the easiest one to overrate. The activity feed is like your front doorbell. Helpful, yes. But your doorbell doesn’t tell you if your house has good plumbing, and this feed doesn’t tell you whether your content strategy is healthy.
This is the green dot and “active now” behavior in DMs and messaging areas. It tells other people whether you seem available, and it tells you the same about them.
For creators, this matters for community management and boundaries. If you leave it on, you may look approachable and easy to contact. If you turn it off, you get more privacy. Neither choice is morally superior. One just makes collaboration easier, while the other protects your attention.
This is your personal usage dashboard. It tracks things like time spent, interactions, search history, links visited, and other records related to how you use Instagram. This area is less about public performance and more about self-management.
For creators, this can be sneakily useful. If your “research” hours keep turning into doom-scrolling marathons, this dashboard will gently expose the lie.
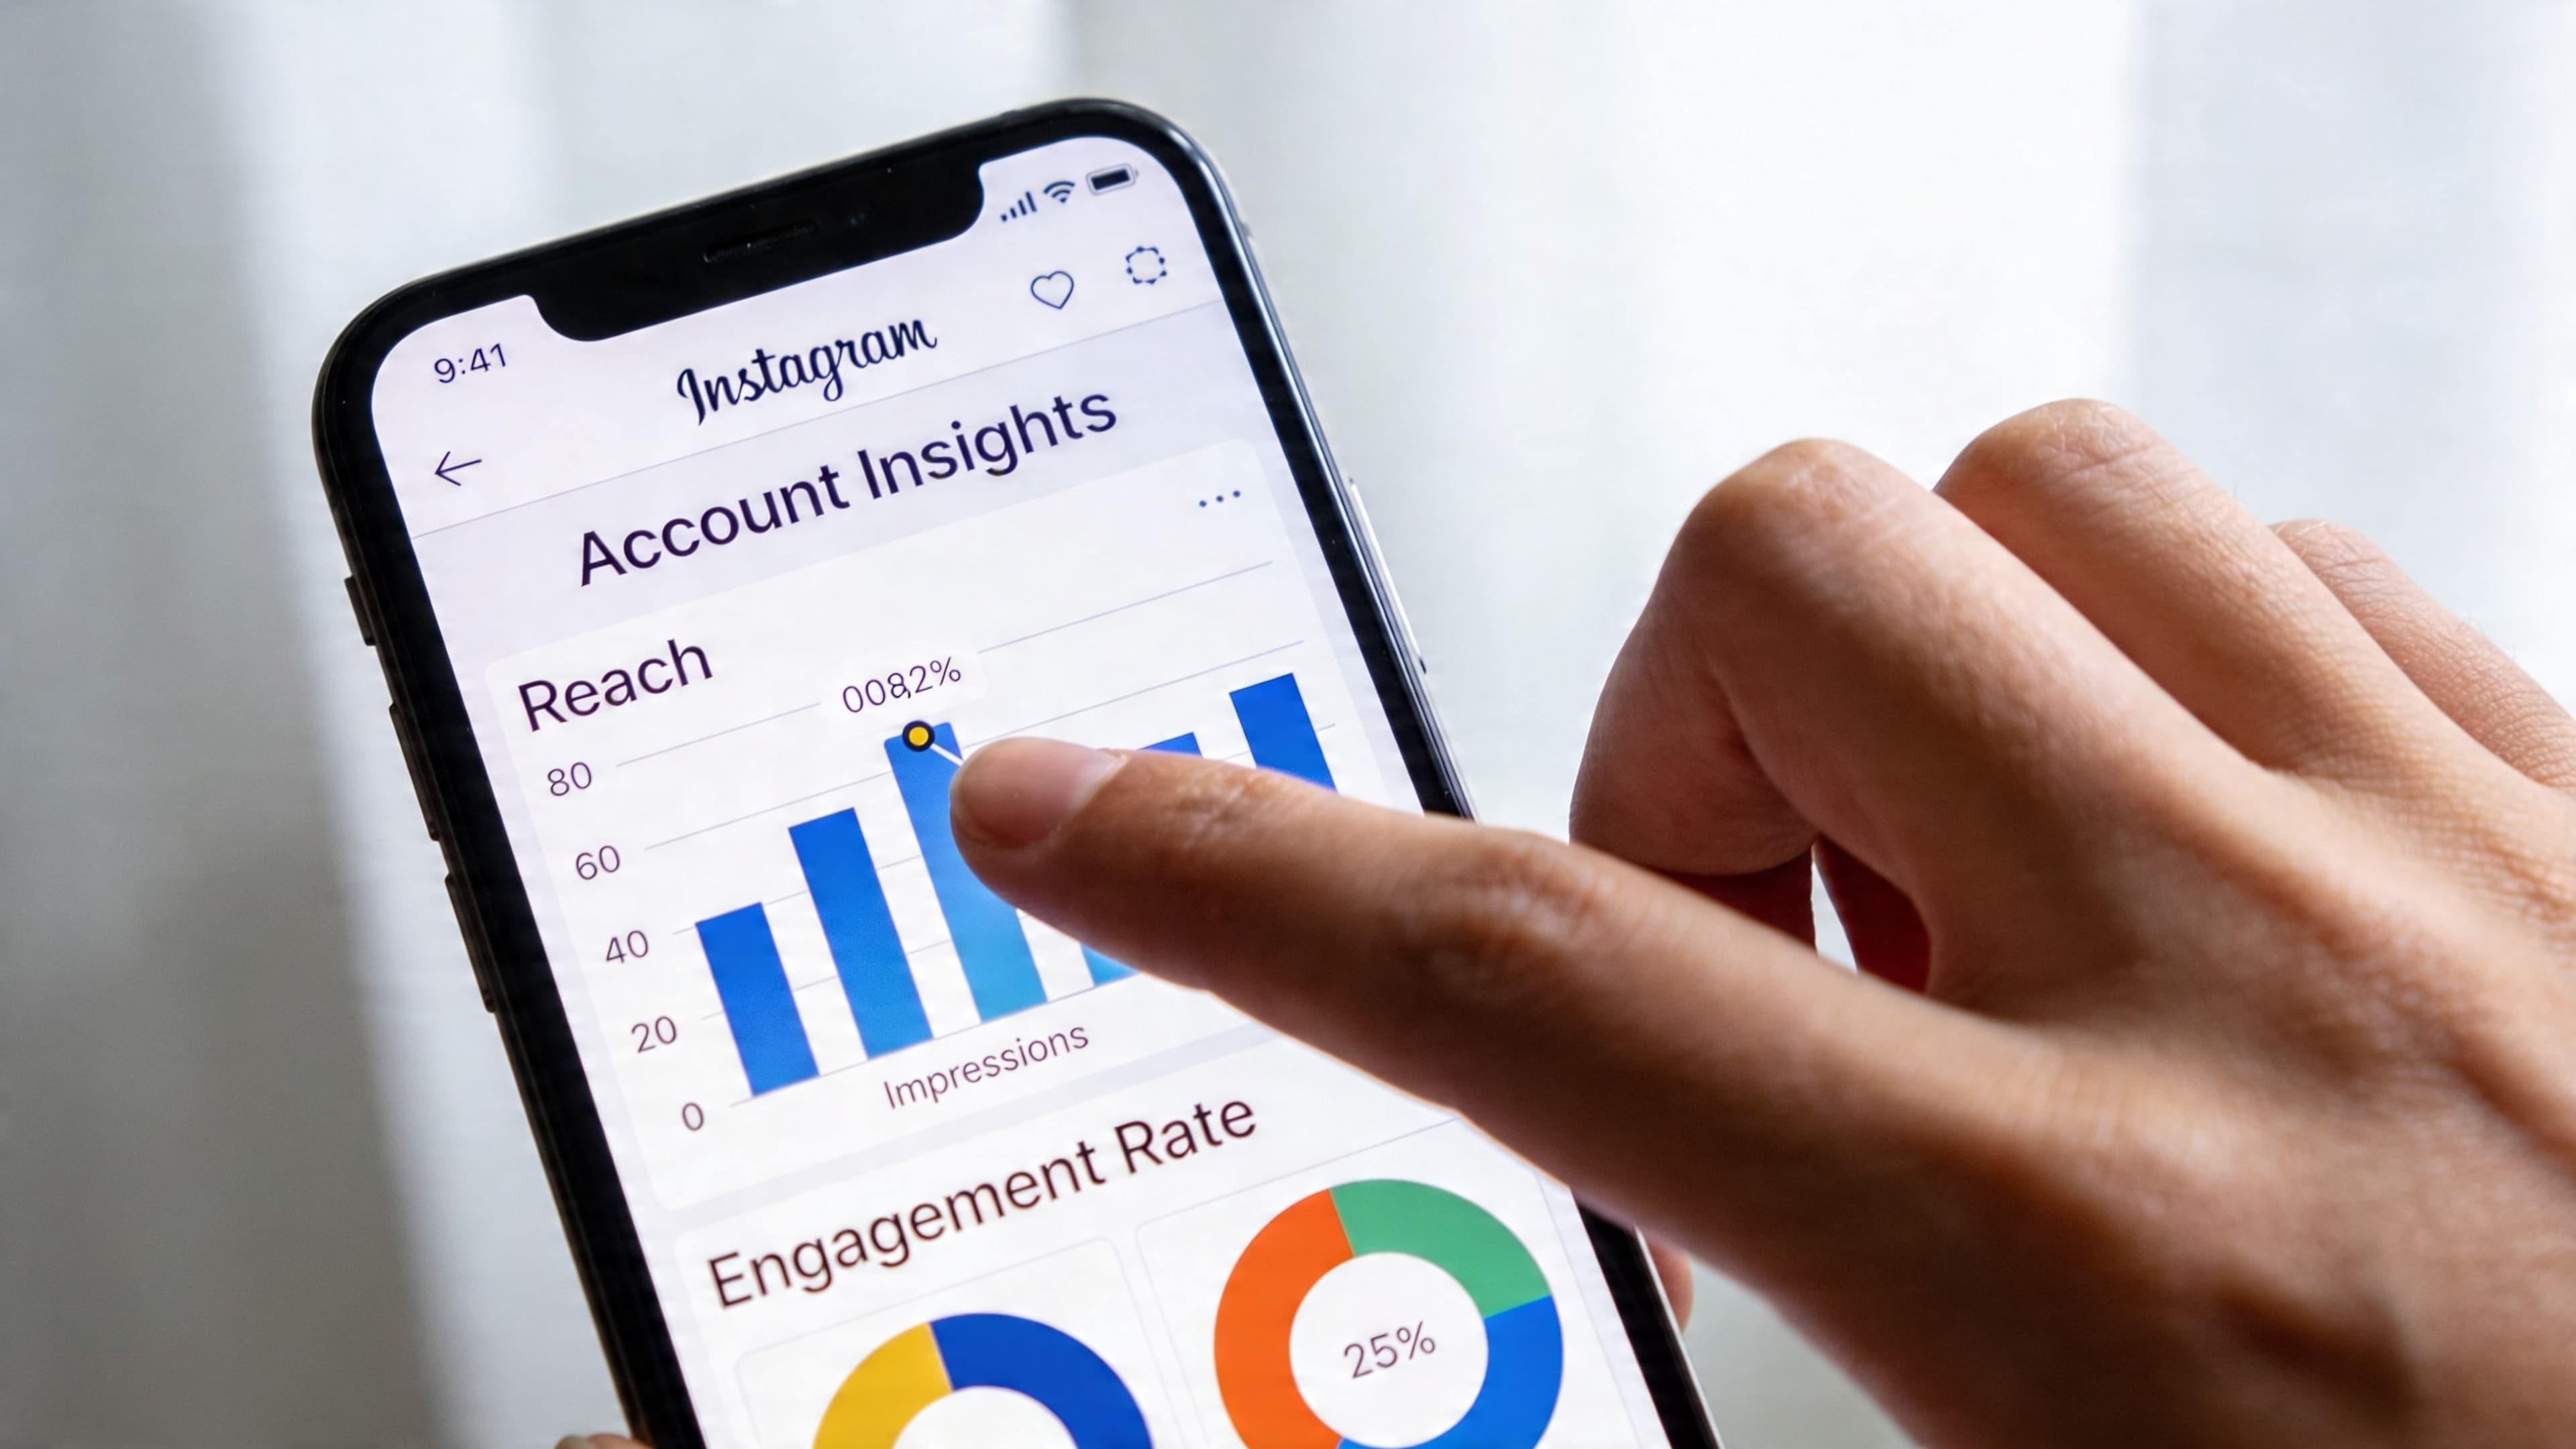
This is the one creators should learn to love, even if it first feels like a spreadsheet in a trench coat. Insights tell you how content performs across reach, interactions, profile actions, and audience behavior.
Strategy is paramount. In this context, terms like impressions and reach also start causing unnecessary panic. If you want a cleaner explanation of one of the most misunderstood metrics, this breakdown of what impressions mean on Instagram is useful.
| Feature Name | What It Is | Where to Find It | Main Purpose |
| Activity Feed | Notifications about interactions | Heart tab and notification areas | Spot conversations and audience reactions |
| Activity Status | Your visible online presence | DMs and messaging settings | Manage availability and privacy |
| Your Activity | Personal usage records and time-spent tools | Settings and activity-related menus | Review and control your own behavior |
| Account Insights | Performance and growth metrics | Professional dashboard and Insights | Evaluate content quality and growth signals |
The trick is simple. Don’t ask one dashboard to answer another dashboard’s question.
The analytics side of activity in instagram is where creators usually swing between two moods. Mood one: “I am a data-driven professional.” Mood two, five minutes later: “Why does this post have reach but no traction, and why do I suddenly need tea?”
The key metric in 2026 is engagement rate by reach. Instagram’s algorithm prioritizes it as a quality signal, calculated as (Total Engagements ÷ Reach) × 100, according to InfluenceFlow’s 2026 Instagram performance guide. In plain English, this measures how strongly people responded after seeing your content.
That matters because reach without response is just a polite shrug.
A post can collect lots of impressions and still fail the “did anyone care?” test. Engagement rate by reach is better because it rewards resonance, not just exposure.
InfluenceFlow’s example makes this easy to grasp. A post with 500 impressions and 50 engagements produces a 10% rate, while a post with 5,000 impressions and the same 50 engagements produces 1%. The first post sends a stronger signal because the people who saw it reacted more intensely.
That’s the algorithmic version of a packed small café beating an empty stadium.
When you open Insights, don’t stare at every number equally. Start with a short stack:
If your audience data looks strange, pause before blaming the algorithm. Sometimes low-quality followers or bot-heavy engagement muddy the picture. If you’re cleaning up your audience or sanity-checking suspicious behavior, this Instagram bot checker guide is a practical resource.
Key insight: A smaller post that earns saves, shares, comments, and profile visits can outperform a broader post that gets glanced at and forgotten.
Here’s a simple creator habit that works. After each post, ask three questions: Did people stop? Did they react? Did they continue into my profile? That sequence is more useful than celebrating views in isolation.
A good analytics workflow also needs context over time. Looking at one post is like judging a TV series from one frame. Tracking patterns across several posts gives you the story. This guide on how to track social media analytics can help you build that habit without drowning in tabs.
For a quick visual reset, this walkthrough is useful:
Post performance doesn’t only reflect topic quality. Format changes the way people engage. A swipeable carousel creates a different behavior pattern than a static photo. A Reel asks for attention differently than a caption-led image.
That’s why your analytics aren’t just scorecards. They’re clues. They tell you whether your idea was weak, your packaging was weak, or your audience needed a different format to care.
Creators often talk about the algorithm like it’s an unpredictable weather system. It’s not that mystical. Instagram watches behavior, including yours, and uses that behavior to understand what kind of account you are.
What you watch, rewatch, save, comment on, and reply to teaches the platform about your interests and your niche. If you spend your time engaging extensively with content in your category, Instagram gets better at mapping your account to similar conversations and audiences. Your scrolling habits aren’t just leisure. They’re training data.
A lot of meaningful behavior happens outside the obvious metrics. You watch a Reel twice. You answer Story polls. You reply to niche creators in DMs. You click through to profiles and linger.
Those actions add up to broader engagement momentum, often described as an Activity Index, a weighted average of actions like profile visits and content interactions. Sustained high indices correlate with stronger follower acquisition because Instagram boosts recommendations when an account shows healthy momentum, as explained in Sotrender’s overview of Instagram metrics.
That’s why “just be active” is both bad advice and oddly correct. Random activity doesn’t help much. Intentional activity does.
Your activity status is part privacy setting, part social signal. Leaving it on can make collaboration smoother. People may be more likely to message when you appear present. Turning it off reduces pressure and makes it easier to work without feeling observed.
Neither setting directly replaces good content. But it changes how accessible you feel, and accessibility affects conversation volume.
Treat your own account like a niche student. Every interaction teaches Instagram what classroom to place you in.
A useful routine is simple. Spend time each week interacting with accounts in your niche, not as networking theater but as genuine market reading. Notice recurring questions. Watch which story formats pull replies. Save posts that trigger comments you’d want on your own content. You’re not wasting time there. You’re sharpening your audience radar.
Let’s move from theory to fieldwork. If your goal is stronger engagement activity, your job isn’t “post more.” Your job is to make it easier for people to react, save, share, and continue the conversation.
In 2025, carousels reached 1.36% engagement for influencers and Reels reached 1.24%, outperforming single photo posts, according to Sprout Social’s Instagram stats roundup. That doesn’t mean photos are illegal now. It means dynamic, multi-part content gives people more reasons to interact.
Carousels work because they create motion. A user swipes, commits, and often stays longer with the post. Reels work because they compress an idea into an easier first impression.
Try formats like these:
A caption shouldn’t behave like a decorative pillow. It should do something. Good captions direct attention, sharpen context, or ask for a useful reply.
Three reliable caption prompts:
Comments rise when the question is easy to answer and specific enough to feel personal.
Most creators ask for too much, too fast. A DM-heavy CTA on an account with weak Story interaction can flop because the audience hasn’t been trained to participate.
Try a ladder:
That pattern teaches your audience that your content is interactive, not just decorative.
When someone comments, don’t leave the room. Replying keeps the thread alive and signals that your content is a place where conversation continues. The same goes for DMs and Story replies. Fast, thoughtful responses help turn one-time viewers into repeat engagers.
If you want more practical ideas beyond the usual recycled advice, this guide on how to increase engagement on Instagram is worth reading alongside a deeper look at ways to increase Instagram engagement.
Use this short checklist:
| Before Posting | Ask Yourself |
| Format | Is this better as a Reel, carousel, or Story sequence? |
| Hook | Would someone understand the payoff quickly? |
| Interaction | Did I give people a reason to comment, save, or share? |
| Follow-through | If this performs well, do I know what topic to post next? |
That last question matters. Engagement compounds when one post naturally leads to another. Think in clusters, not isolated uploads.
You open Instagram to check one thing and end up in four different control rooms. Feed activity shows who reacted. Status hints at when people might be around. Your time data reveals how often you are opening the app. Analytics shows what content moved people. By that point, posting can feel less like strategy and more like trying to cook dinner while four timers are going off.
That confusion is the primary problem. Instagram gives you plenty of readings, but it rarely connects them into a next step. A creator can see strong reach, weak profile visits, lots of Story taps, and inconsistent replies, then still have no clear answer to a simple question: what should I post next, and why?
A planning system fixes that gap.
The Trendy features overview shows how that kind of system works in practice: you connect your account, review audience and post-performance patterns, spot stronger timing and topic trends, and turn scattered activity signals into a usable content plan.
Trendy is helpful here because it treats Instagram activity like one machine instead of four unrelated dashboards. Feed activity tells you what pulls visible engagement. Status and timing patterns help you choose when people are most likely to respond. Your personal activity habits reveal whether you are reacting impulsively or publishing with intention. Performance analytics confirms which combinations lead to reach, visits, saves, and follows.
That matters because these signals influence each other. If your personal habit is doom-scrolling at random hours, your posting schedule often becomes random too. If your feed activity shows comments but your analytics shows weak profile actions, the content may be entertaining without being persuasive. If Story activity is strong but posts stall, your audience may like interacting with you but need clearer reasons to share or save your content.
Trendy helps organize those patterns into decisions. Instead of asking, “Should I post because I have not posted today?” you can ask, “Which format, topic, and timing fit the audience behavior I am seeing right now?”
That is a much better question.
In real use, that means less hopping between tabs and more pattern recognition. You can look at which ideas create profile visits, which formats build momentum across multiple posts, which posting windows produce stronger early engagement, and which content attracts the audience you want. AI is useful here for the same reason a good GPS is useful in a messy city. It does not drive for you. It stops you from making every turn by guesswork.
The result is calmer, sharper publishing. You spend less energy interpreting disconnected activity screens and more energy making content that fits what your audience is already showing you.
You open Instagram to check one thing, and ten minutes later you are knee-deep in likes, green dots, profile visits, and watch time, wondering which of these matters. That confused feeling is normal. Instagram stores different kinds of activity in different rooms, then hands you the whole key ring at once.
The shift happens when you stop reading each screen in isolation. Feed activity shows what pulled attention. Status activity shows when conversation is easiest. Your time activity shows how your own habits shape consistency. Analytics shows which actions turned attention into something useful, like saves, shares, visits, or follows.
Those four views work like a dashboard in a car. One gauge tells you speed. Another tells you fuel. Another warns you when the engine is running hot. Looking at only one might feel productive, but it will not get you very far.
Creators grow faster when they connect the signals. A post that gets comments in the feed can teach you what topics spark response. Your status patterns can help you publish when your audience is more ready to interact. Your own usage habits can explain why your posting feels rushed or random. Analytics then confirms whether the whole system is producing real momentum instead of busy-looking numbers.
That is the move from checking activity to using it.
If you want a simpler way to turn Instagram activity into next-step decisions, try Trendy. It helps creators spot patterns across performance, audience behavior, and posting habits without living inside dashboards all day.
