
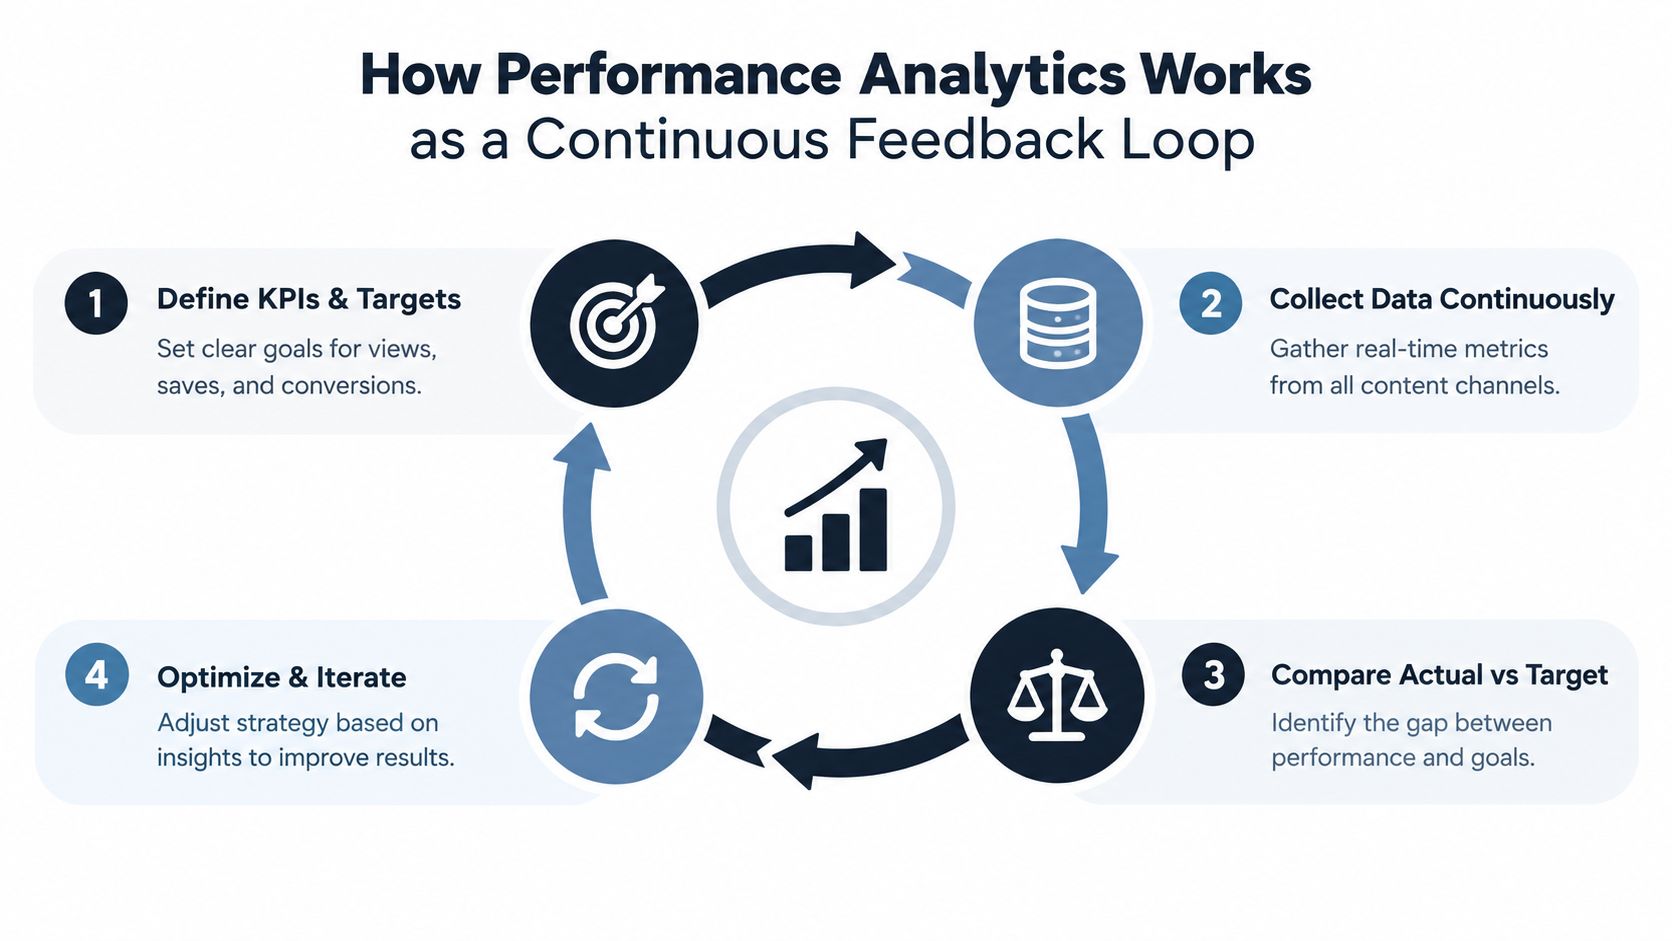
Performance analytics is a continuous closed-loop system that defines KPIs against targets, collects data continuously, and uses the gap between actual and expected performance to decide what to post next. It turns scattered views, saves, watch time, and clicks into a practical publishing system instead of a one-time report.
You post an Instagram Reel, check the numbers, feel encouraged by the views, then wonder why profile visits barely moved. The next day, you publish a TikTok with a new hook, but you aren't sure whether the idea was weak, the timing was wrong, or the format failed to hold attention.
That uncertainty is the creator version of flying without a dashboard. Performance analytics gives you the instruments. It helps you define what success means, read the signals, and make a better next move.
For a business, that might mean tracking conversion rate, customer acquisition cost, return on ad spend, cost per lead, win rate, gross margin, or monthly recurring revenue. For a creator, the same discipline appears through reach, impressions, engagement, retention, saves, shares, profile visits, follows, and clicks. The principle is identical: connect measurement to a decision.
The field has a longer history than social media. A General Electric corporate staff group developed performance measures for management use in the 1950s, and Robert S. Kaplan and David P. Norton introduced the Balanced Scorecard in the early 1990s, expanding measurement beyond financial results to a broader strategic view of organizational performance, as explained in this history of performance analytics.
Creators need that broader view because a post can attract attention without changing behavior. A Reel might earn views but no saves. A TikTok might generate comments but no profile exploration. Analytics helps you ask the more valuable question: what caused people to keep watching, return, follow, share, or take the next step?
If you want a wider foundation before applying this to content, read what social media analytics means. You can also isolate sounds with natural language when clean audio is part of the creative test. The aim isn't to become a spreadsheet hobbyist. It's to replace random posting with a feedback habit that makes your next Instagram, TikTok, carousel, LinkedIn post, or Threads/X post more intentional.
How Performance Analytics Works as a Continuous Feedback Loop
A creator publishes an educational Reel expecting saves, but the post earns views and little follow-up action. Performance analytics turns that gap into a next move. It works like a GPS for content, comparing the intended destination with the audience's actual path, then helping you adjust before a promising trend peaks.
Start with an outcome, not a dashboard
Begin with a publishing outcome. “Get more engagement” is too broad to guide a decision. A clearer aim might be making educational Reels worth saving, increasing profile visits, or turning product demonstrations into clicks.
Choose KPIs that can test that aim. Saves fit reusable education better than casual likes. Profile visits show curiosity beyond the initial post. Clicks connect content activity with a business action.
A useful KPI has three qualities:
- Alignment: It connects directly to the result you want.
- Measurability: You can collect it consistently.
- Actionability: The result points to a specific adjustment.
This structure separates attention from behavior change. If the goal is qualified traffic but you optimize only for views, you may create entertaining posts that attract broad attention without moving interested people toward your offer. JasperSoft describes performance analytics as a process linking KPIs, targets, ongoing collection, and corrective action in its performance analytics overview. For practical examples, review these social media analytics feedback loop examples.
Compare actual performance with the target
After publishing, collect the results and compare them with the expected journey. Ask which stage worked and where people stopped. A post can win attention while losing action. Strong reach with few profile visits may signal a mismatch between the video and the account promise. Good retention with few saves may mean viewers enjoyed the delivery but found no reason to keep the information.
Practical rule: Every metric should lead to a question, and every question should lead to a publishing decision.
Change one meaningful variable
Use the gap to make one focused adjustment. Rewrite the opening line, simplify the scene structure, change the call to action, shorten the explanation, or adapt the same idea into a carousel. Changing everything at once hides the cause of the new result.
Historical data makes the loop more useful. ServiceNow documents historical data collection for generating scores and snapshots from existing records when Performance Analytics is first configured, allowing comparisons with earlier periods in its historical data collection guidance. Keep previous posts available. Older results can reveal recurring hooks, formats, and behavior patterns that one dashboard view cannot show. Each cycle then becomes a forward-looking operating system for your content, helping you post with evidence rather than wait for a monthly report.
Key Social Metrics That Actually Matter and What They Tell You
Metrics become useful when you know what behavior they represent. A number isn't automatically an insight. It becomes an insight when it helps you decide whether to improve the hook, change the format, revise the offer, or repeat the idea.
Distribution metrics show who had a chance to see the post
Reach represents the audience exposed to your content, while impressions represent content displays. They answer a distribution question: did the platform put this post in front of people?
High distribution doesn't prove that the content connected. It creates an opportunity for connection. Compare reach with watch time, saves, shares, profile visits, and follows to see whether exposure turned into interest.
Engagement metrics show immediate response
Likes and comments offer quick feedback, but they don't carry the same meaning. A comment can signal curiosity, disagreement, or a request for help. A save often suggests practical value, while a share can indicate that the viewer believes someone else should see the post.
Engagement rate needs careful interpretation. It can be normalized by impressions or followers, and those denominators answer different questions. An impressions-based rate evaluates resonance per exposure. A follower-based rate evaluates how responsive the existing audience is, independent of distribution volume. Platform algorithms influence impressions, so the wrong denominator can make better creative look like better distribution.
| Your Question | Use This Denominator | What It Reveals |
| Did the content resonate with people who saw it? | Impressions | Creative response per exposure |
| Did my existing audience respond? | Followers | Audience responsiveness |
| Did this post earn meaningful attention beyond likes? | Impressions plus saves, shares, and comments | Depth of response among viewers |
| Did distribution improve without creative improvement? | Compare both approaches | Separation between reach effects and content quality |
Use platform- and format-specific comparisons, then re-benchmark regularly. A short educational TikTok, a product carousel, and a personal Instagram Reel shouldn't be judged as if they serve the same job. The denominator discussion and benchmark principle are covered in this social media engagement benchmark guide.
Attention metrics reveal whether people stayed
Watch time tells you how long viewers remained with the content. Retention adds shape to that number by showing where attention dropped. If people leave immediately, the opening may be unclear. If they leave after the setup, the promise may not be delivered quickly enough. If they stay but don't act, the post may entertain without creating a next step.
For Reels and TikTok, retention can guide scene order, caption density, pacing, and the point at which you reveal the main idea. A strong hook earns the chance to explain. A strong structure earns the chance to convert.
Behavior metrics connect content to intent
Profile visits, follows, link clicks, direct messages, and conversions show movement beyond the post. They help you distinguish a memorable piece of content from a useful business asset.
If a post receives attention but no profile visits, test a clearer account promise or a more relevant call to action. If profile visits rise without follows, audit the profile's bio, pinned posts, and visual consistency. The broader social media KPI guide can help you map metrics to different objectives.
For idea research, even a niche-specific resource such as TikTok campaign ideas for hotels can prompt a useful comparison. The question isn't whether hotel content matches your niche. It's whether the format, hook, or audience promise gives you a structure worth adapting.
Why Views Can Lie and How to Spot Real Performance Signals
Views are easy to notice because platforms display them prominently. They also create an emotional shortcut. A large number feels like proof, but it only tells you that the content was watched or displayed according to the platform's measurement system. It doesn't explain what happened afterward.
A video can spread because an algorithm distributed it widely, even if viewers didn't find it useful enough to save or share. Another post can reach a smaller audience but attract profile visits, meaningful comments, follows, or clicks. Those posts have different jobs, and a view count alone can't tell you which job was completed.
Separate attention from behavior change
Use a simple sequence:
- Attention: Did people see the post?
- Consumption: Did they watch long enough to receive the idea?
- Response: Did they save, share, comment, or revisit it?
- Intent: Did they visit the profile, follow, message, or click?
- Outcome: Did the action support the business or creator goal?
This sequence prevents you from treating every metric as interchangeable. Views answer the first question. They don't answer the last four.
The same metric can also mean different things across content categories and audience compositions. A save on a recipe post may signal future utility. A save on a personal story may reflect emotional resonance. A comment on a tutorial may show confusion that needs clarification, while a comment on a trend video may extend the conversation.
A high-view post is a lead, not a verdict.
Check for causal clues without pretending certainty
Platform analytics can't always prove that a post caused a conversion. Attribution can be incomplete, especially when viewers discover you in one place and act later somewhere else. Still, you can look for stronger signals by comparing the post's downstream behavior with similar content and by using clear calls to action.
Track whether the post produced a meaningful chain: watch, profile visit, follow, click, or message. Then compare that chain across formats and platforms. If a Reel gets broad reach but a carousel earns more saves and profile visits, the Reel may be better for discovery while the carousel does more work for consideration.
Distribution changes can distort comparisons. Re-benchmark by platform and format so you can tell whether a result came from better creative or wider delivery. For a useful distinction between exposure counts, read views versus impressions. If you're evaluating offline activity too, the same discipline applies when you measure print campaign ROI, where response must be connected to an outcome rather than judged by exposure alone.
Turning Analytics Into Your Next Winning Post
Analytics earns its place in your workflow when it changes what you make next. A post shouldn't sit in a dashboard like a fossil. It should become raw material for the next hook, format, scene order, or publishing decision.
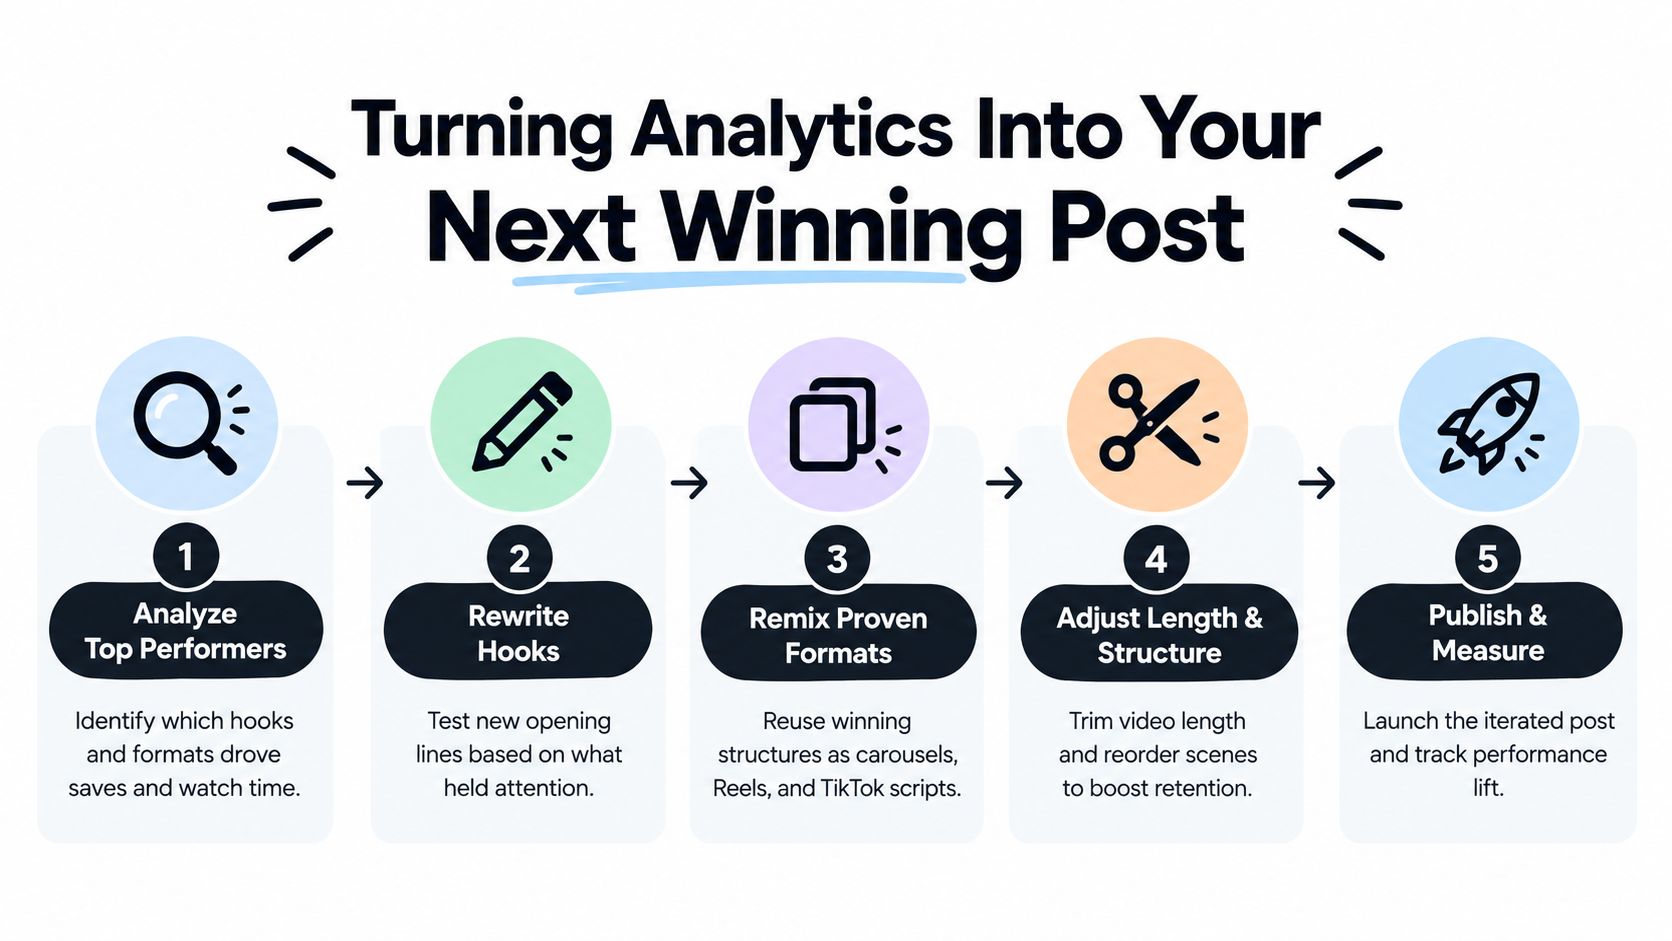
Start with the top performers, but don't copy them blindly. Identify the specific ingredients that may have helped: a direct opening, a fast demonstration, a question, a strong visual contrast, a familiar sound, or a concise payoff.
Then turn that observation into a controlled remix.
- Rewrite the hook: Keep the topic, but test a different first sentence. Replace a broad introduction with the audience's immediate problem.
- Remix the structure: Convert a successful Reel into a TikTok script, a carousel, or a LinkedIn post. Preserve the argument while adapting the pacing to the format.
- Change the scene order: Put the result before the explanation if viewers drop during the setup.
- Adjust the length: Remove pauses and repeated context when retention falls early. Add clarity when viewers stay but don't act.
- Review timing: Compare posts published in similar conditions, then test a different window when your audience appears active.
Instagram Reels require particular care because creation method affects the available length. Instagram Reels have a minimum length of 3 seconds, and the maximum varies by creation path. Current guidance reports that in-app Reels can reach 3 minutes for many accounts, while some rollouts and uploads allow up to 20 minutes, so check whether you're recording in Instagram or uploading a pre-edited clip before planning the edit, as explained in this Instagram Reel length guide.
The 3-minute threshold is also a discovery boundary. Current guides report that Reels longer than 3 minutes aren't recommended to new audiences in the Reels tab, which can make a technically permitted upload a poor choice for discovery, according to this Reels size and duration reference. Instagram expanded the in-app creation limit from 90 seconds to 3 minutes in January 2025, as reported by Social Media Today.
The right lesson isn't “always make shorter videos.” It's “match length to the job.” A concise Reel may earn discovery, while a longer upload may serve an existing audience. Publishing to the feed can also surface content in the Reel ecosystem, and recording inside Instagram, uploading edited video, and using feed workflows can have different ceilings, as outlined in Buffer's Instagram Reel length guide.
Historical comparison adds another layer. ServiceNow's approach to historical data shows why earlier records matter: they let teams compare current conditions with previous periods rather than treat every result as isolated. For creators, that means keeping notes on the hook, format, length, topic, timing, and intended action. Those notes turn a content calendar into a learning record.
Your Trendy Workflow From Profile Audit to Performance Analysis
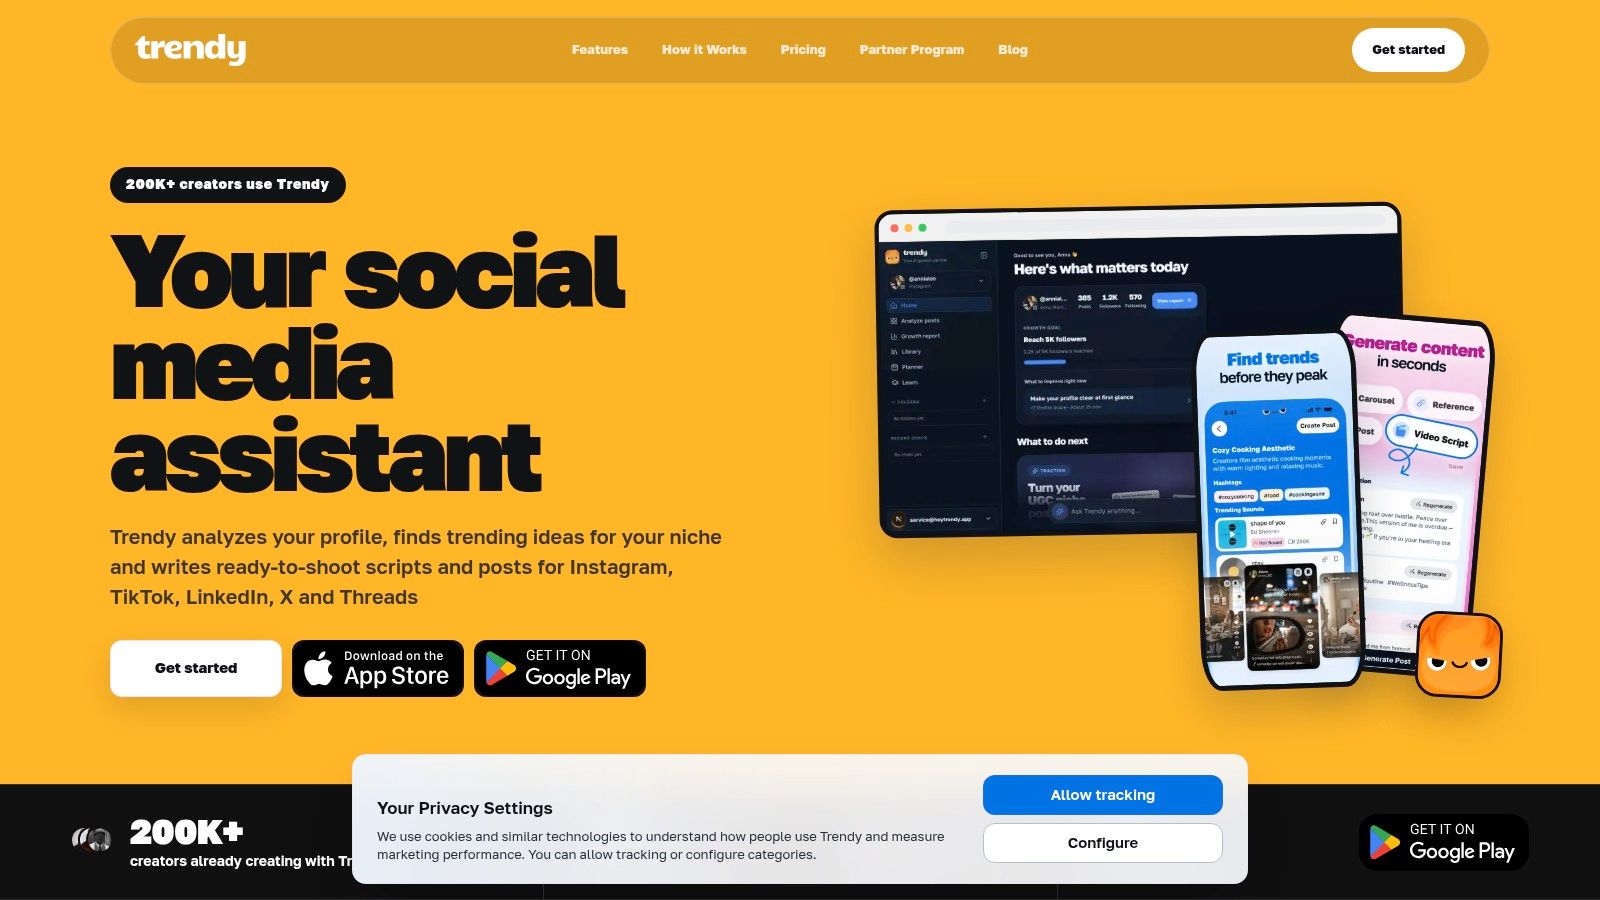
A post can attract attention and still leave your account unclear. Trendy gives that attention a working path across formats: Profile Audit → Trends & Ideas → Content Creation → Performance Analysis. Each stage supplies the next decision, turning analytics from a retrospective report into an operating system for your publishing process.
Profile Audit
Start with the account before choosing the next post. Review the bio, positioning, pinned content, visual identity, and recent publishing choices against the audience you want. A post that brings profile visits has created an opportunity. If the profile does not explain what visitors should do next, that opportunity stops there.
Record the starting point with a structured social media audit template. It gives later performance comparisons a clear baseline, so changes in visits, follows, or clicks have context.
Trends and Ideas
Use that account context to filter emerging sounds, hashtags, topics, and formats. A trend earns a place in your plan when it connects to your audience's problem, your visual style, and the action you want viewers to take.
Performance analytics can also look ahead. Fast-moving feeds create short timing windows. If an early signal suggests that a format is gaining attention, prepare a relevant version before the feed becomes crowded. The signal guides a decision. It does not guarantee the result.
Content Creation
Turn the selected idea into a publishable asset. Trendy supports personalized post ideas, hooks, scene structures, ready-to-shoot video scripts, carousels, and visual post concepts for Instagram and TikTok. The same insight can also become LinkedIn posts or Threads/X posts, with the structure adjusted for each format.
A TikTok version might include a spoken hook, scene order, on-screen text, and an editing plan. On Instagram, the concept could become a Reel, carousel, or Story sequence. One audience insight becomes several deliberate tests instead of one copied upload.
Performance Analysis
After publishing, match the review to the intended outcome. Examine whether attention led to meaningful behavior, such as profile activity, follows, saves, shares, or clicks. Trendy's performance analysis helps connect the result to the original audit and idea, so the next concept starts with evidence rather than a guess.
You can access Trendy through its iOS application, Android application, or the Trendy web app. It supports creators, small businesses, and social teams building one planning habit across multiple formats instead of managing separate tools for every channel.
Keep Improving With a Smarter Analytics Habit
Performance analytics becomes useful when it runs like a publishing loop, not a report opened after disappointment. Set an objective, choose its KPI, review behavior, and change one meaningful variable at a time.
For each cycle:
- Choose one outcome: Define whether the post should earn attention, saves, profile visits, follows, clicks, or another action.
- Record creative variables: Note the hook, format, length, topic, timing, and call to action.
- Review the full path: Compare views with watch behavior, saves, shares, profile activity, and later actions.
- Make one remix: Adjust the opening, structure, format, or timing according to the clearest signal.
- Feed the result forward: Add the lesson to the next idea and content plan.
A forward-looking system helps you spot early opportunities before a trend peaks. It also separates vanity attention from behavior change, so rising views do not automatically define success. Over time, each post becomes a small test that makes the next decision less dependent on guesswork across Instagram, TikTok, LinkedIn, Threads, and X.
Trendy links profile audits, trend discovery, content creation, and performance analysis in one cross-format workflow. Its ready-to-shoot scripts, hooks, carousels, and post concepts can support the next publishing decision. Visit Trendy, connect your account, and use the personalized insight report to decide what to publish next and why.